
Both two charts and graphs are widely used diagrams that are used for various purposes in various ways. All types of graphs are considered as a type of charts, but all charts can move graphs.
Key Takeaways
- Charts present data in a structured, visual format, including tables, bar charts, and pie charts.
- Graphs display data points and their relationships, such as line graphs, scatter plots, and area graphs.
- Charts provide a clear overview of data categories and values, while graphs reveal trends, patterns, or correlations.
Chart vs Graph
All graphs are charts, while all charts are not graphs. A graph is ideal for data that depicts some trend or relation between variables described on the graph; charts don’t depict data which has no trend or relationship. Charts are used to present large data and can be in the form of tables or graphs.

A chart is a type of graphical representation of data that is made with the use of symbols. Bar chart, pie chart, and line chart is various types of charts. An elaborated, vast data can be translated into a chart that is comprehensible and easily recognisable.
Graphs are used widely in the field of mathematics. This diagram illustrates data in a pictorial representation where the mathematical connection can be recognised easily.
The two axes of a graph denote categories and numbers, and it helps to see the connections between the various aspects mentioned in the given data.
Comparison Table
| Parameters of Comparison | Chart | Graph |
|---|---|---|
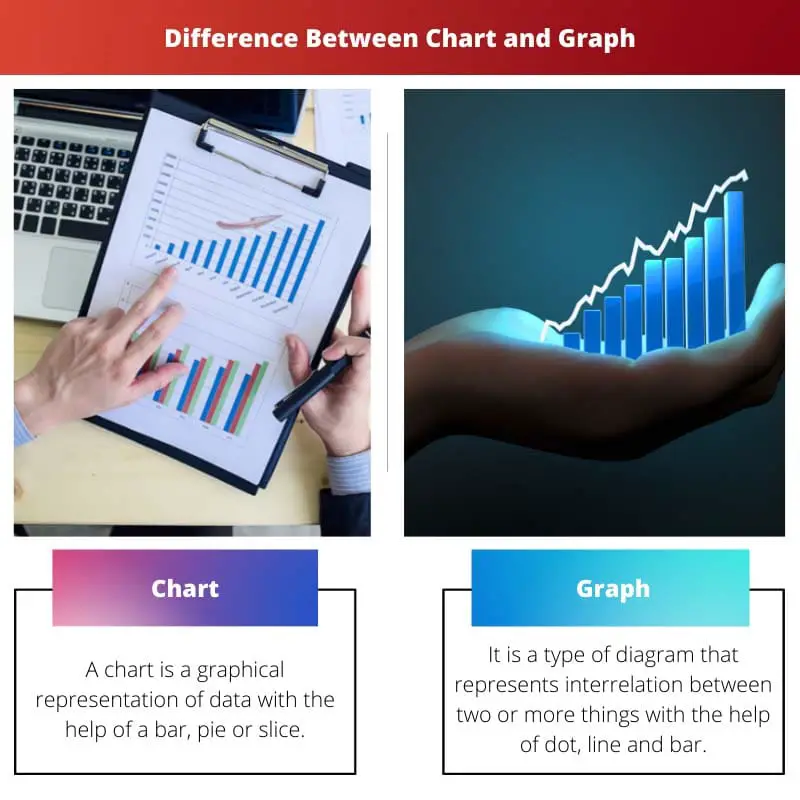
| Definition | A chart is a graphical representation of data with the help of a bar, pie or slice. | It is a type of diagram that represents interrelation between two or more things with the help of dot, line and bar. |
| Presents | A chart represents data or information. It is a compact way to depict data. | The graph represents the mathematical relationship between various data. |
| Usage | A chart is most useful in a business presentation or to portray the results of a survey. | A graph is used mostly for analytical fields. |
| Goal | The aim of a chart is to present different types of data translated into patterns. | Graph aims to depict the mathematical connection in a set of data. |
| Types | Some popular charts are pie charts, bar charts and histograms. | Line graph and bar graph are the two most commonly used graphs. |
What is Chart?
A chart can be defined as a graphical representation of data that provides a visualization experience that is appealing and engaging. In a chart, the data is represented with the use of symbols.
The symbols decide the name of the chart. For example, a chart that is made using bars is called a bar chart, a chart that uses lines is a line chart, and a chart that is prepared with slices is called a pie chart. A chart is capable of representing tabular numeric data.
A chart is used widely in presentations. It illustrates the results of a survey and makes it very simple to understand. The patterns represent the set of data. Charts are frequently used to illustrate large quantities of data that become easy to comprehend.
Also gives a clue about the relationships between various parts of the data used. Raw data might seem overwhelming and might create confusion, but if that data is translated into a chart, then it can be read easily and quickly.
Charts can be made manually as well as by using computers. We make charts in school on graph paper, and on a computer, we can also make charts using any chart-making application or MS Word.

What is Graph?
A graph is a tool of mathematics. A graph is a diagram. It is a pictorial representation of data or values in an organized way that helps to comprehend the mathematical connection between various aspects of the data.
Association between two or more things can be determined using a graph. Lines, line segments, curves, or areas are types of various graphs.
Bar and line graphs have axes that are mostly defined as the x-axis and y-axis. The x-axis carries the categories, and the y-axis bears numbers. These are always interchangeable.
Thus the numbers can be examined and compared based on their categories and numbers. A graph can be made by hand and by a computer as well. A graph is a considerable tool for analytic purposes.
Main Differences Between Chart and Graph
- The purpose of a chart can be summarised by saying it presents different types of data translated into patterns that are visually appealing and enticing. But a graph intends to illustrate the mathematical connection between a set of data.
- On the one hand, a chart embodies data or information. It is a compact and convenient way to illustrate data, whereas on the other hand, the graph represents the mathematical connection and association between various employed data.
- A chart can be proven most productive in a business presentation or to illustrate the results of a survey, whereas a graph is mostly utilized in analysis works.
- Pie charts, bar charts and histograms are some of the most distinguished types of charts. And on the other hand, line graphs and bar graphs are the two most commonly tried graphs.
- Charts are meant to categorise data, but graphs identify patterns and connections between the data.
- http://eng260.tolearn.net/wp-content/uploads/2015/08/which_chart.pdf
- https://search.proquest.com/openview/7f798918540f556cc1738cf426590924/1?pq-origsite=gscholar&cbl=40590
Last Updated : 10 August, 2023

Sandeep Bhandari holds a Bachelor of Engineering in Computers from Thapar University (2006). He has 20 years of experience in the technology field. He has a keen interest in various technical fields, including database systems, computer networks, and programming. You can read more about him on his bio page.


The article aptly captures the essence of both charts and graphs, providing an insightful comparison and practical uses.
I particularly enjoyed the detailed illustrations. It’s informative and easy to comprehend.
Very well-articulated piece. The distinctions are crystal clear and understandable.
This article provides an extraordinarily clear comparison between charts and graphs. I found it enlightening and educational.
Couldn’t agree more. The in-depth exploration is truly commendable.
The post provides a highly comprehensive overview of charts and graphs, dissecting the nuances and significance of each with clarity.
Absolutely. The post is a rich source of information that is both educative and enlightening.
I concur with the sentiments expressed. The post is informative and well-structured, offering valuable insights.
This article efficiently distinguishes between charts and graphs, shedding light on their distinct purposes and features.
Agreed. It definitely clarifies the purpose and functionality of each, making it an invaluable resource.
This article serves as a comprehensive guide to understanding the intricacies of charts and graphs. A thoroughly thought-provoking piece.
Absolutely. The clarity and in-depth analysis make it an essential read for anyone delving into this subject.
This is a fascinating article explaining the differences between charts and graphs. The differences are clear and concise.
I completely agree. The graphics are well defined and provide a comprehensive understanding.
Well-written piece. Can’t argue with the classifications and uses of both.
This article meticulously explains the core differences and uses of charts and graphs, making it an indispensable resource for understanding these concepts.
Precisely. This is a comprehensive and illuminating guide that clears up any confusion between charts and graphs.
Understanding charts and graphs are essential. This is an informative article that deciphers the differences and purposes of each.
Absolutely. I found this to be very helpful. It’s great for anyone looking to delve into this topic.
This article is perfect for understanding the role of charts and graphs. The definitions are clear and concise.
An excellent analysis and comparison of charts and graphs. A highly informative and insightful read.
I couldn’t have said it better. The article truly captures the distinctive features of charts and graphs.
The article effectively highlights the key differences and uses of charts and graphs. It’s a valuable read for anyone seeking to understand these concepts.
The usefulness and distinct nature of charts and graphs are well elaborated. Great post!
Absolutely. I appreciate the detailed comparison. This post provides a comprehensive overview.