Parameter and Statistics might look like similar terms but they are different from each other. A parameter is a numerical value obtained from a population while the statistics is a numerical value obtained from the sample.
A parameter takes each and every person involved in an entire population into consideration whereas the statistics includes the data it receives from a selected sample without including the entire population.
Key Takeaways
- A parameter is a numerical characteristic of a population used to describe or make inferences about the population; a statistic is a numerical characteristic of a sample used to estimate the population parameter.
- Parameters are fixed and unknown values that describe a population; statistics are sample values that may vary from sample to sample and are used to estimate population parameters.
- Parameters are more important in statistical inference since they provide insight into the population being studied; statistics are important for analyzing samples and making predictions about populations.
Parameter vs Statistic
A parameter is a numerical value that describes a characteristic of a population. Parameters are unknown and are estimated using sample data. A statistic is a numerical value that describes a characteristic of a sample. It is calculated from sample data and is used to estimate the corresponding parameter.

Comparison Table
| Parameters of Comparison | Parameter | Statistic |
|---|---|---|
| Definition | Parameter is a descriptive measure of population. | Statistic is a descriptive measure of sample. |
| Measure | It is nearly impossible to measure a parameter. | A statistic can always be measured. |
| Standard Deviation | The standard deviation for a population is represented by σ. | The standard deviation for a sample is represented by s. |
| Population | ||
| Parameter | The variance for a population is represented by σ2. | The variance for a sample is represented by s2. |
| Population Size | The parameter for the size of a population is given by N. | The statistic for the size of a sample is given by n. |
| Symbol | The mean or average for a population is represented by µ. | The mean or average for a sample is represented by x̅. |
What is Parameter?
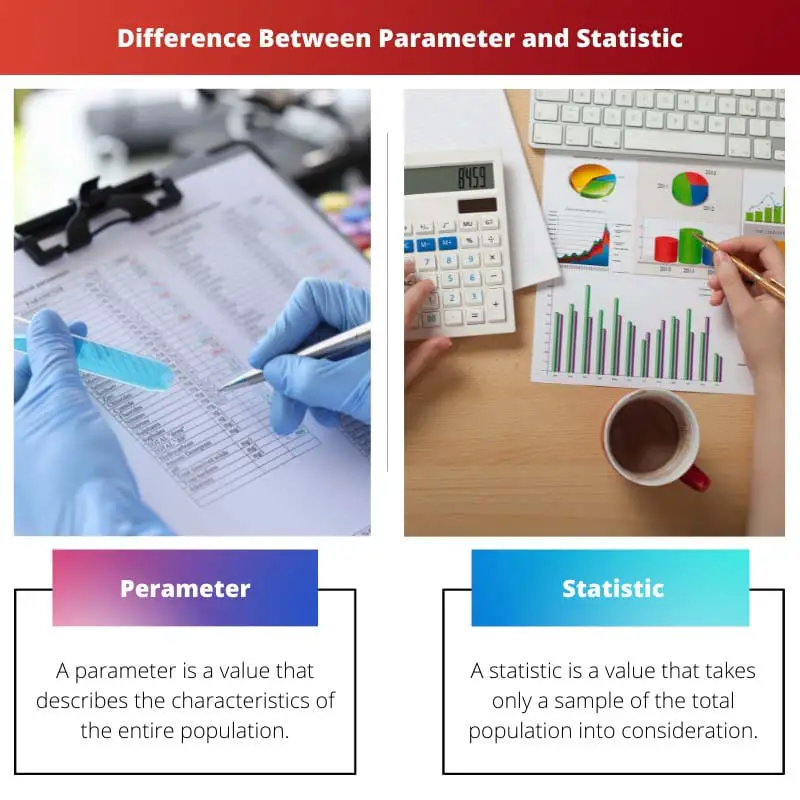
A parameter is a value that describes the characteristics of the entire population. It is nearly impossible to determine the parameter, especially in case of a large population.
A parameter can be easily determined for a very small population where every individual can be located with complete certainty. It becomes easy to calculate a parameter if all individuals can be located and measured without missing a single individual.
Parameter has a variety of indications with their symbols like µ for mean, σ2 for variance and σ for standard deviation. A parameter used to represent the total size of the population is indicated by the letter N.
This is for a population. These values are calculated from a sample which is assumed to represent the population.
A parameter has a normal bell-shaped curve for a population which can be characterized by two parameters, the average or mean and amount of variation (represented by the variance and standard deviation). An example for calculating parameter could be the quantity of calcium present in the diet of all middle school children on daily basis for a single school.
In this case, each and every middle school child is counted and the data can be obtained without missing a single child included in the population.

What is Statistic?
A statistic is a value that takes only a sample of the total population into consideration. It is based on a sample. A statistic is an estimate of a parameter.
It might be a random sampling or a result of some predefined factors for choosing a sample. Sampling is a way to collecting information or data for a given population without the actual measurement of every individual in the population.
The process of sampling becomes necessary as it is nearly impossible to measure or count each and every individual in a population as populations are sometimes so large and it becomes hard to find about every individual. Parameter has a variety of indications with their symbols like x̅ for the mean, s2 for the variance and s for the standard deviation.
A parameter used to represent the total size of the sample is indicated by the letter n. These values are calculated from a sample that represents the population.
An example for calculating statistics could be the number of people who prefer to use the public bus as compared to the local train for going to the office. Here, the opinion of a sample of people is taken into consideration as it is impossible to ask every single person for an opinion.
The rest of the data is derived from the pattern shown by the data obtained.

Main Differences Between Parameter and Statistic
- A parameter is an illustrative measure of a population whereas a statistic is a illustrative measure of a sample.
- A parameter is an actual value calculated for a population whereas a statistic of a sample is used to calculate an estimate for a population.
- A parameter is nearly impossible to measure whereas a statistic can be easily measured.
- The parameter variance for a population is represented with σ2 whereas the sample variance for a sample is represented with s2.
- The parameter for the size of a population is represented with the letter N whereas the statistic for the size of a sample is represented with the letter n.
- The parameter mean or average for a population is represented with µ whereas the statistic mean or average for a sample is represented with x̅.
- The parameter standard deviation for a population is represented with σ whereas the statistic standard deviation for a sample is represented with s.
- The result obtained from the parameter is fixed whereas the result obtained from the statistics varies with the size of the population.
- It takes less time to conduct a survey for calculating the parameter whereas it takes more time to conduct a survey for the calculation of the statistics.
- The parameter involves less cost in conducting the survey whereas the statistics involves more cost in conducting the survey.


