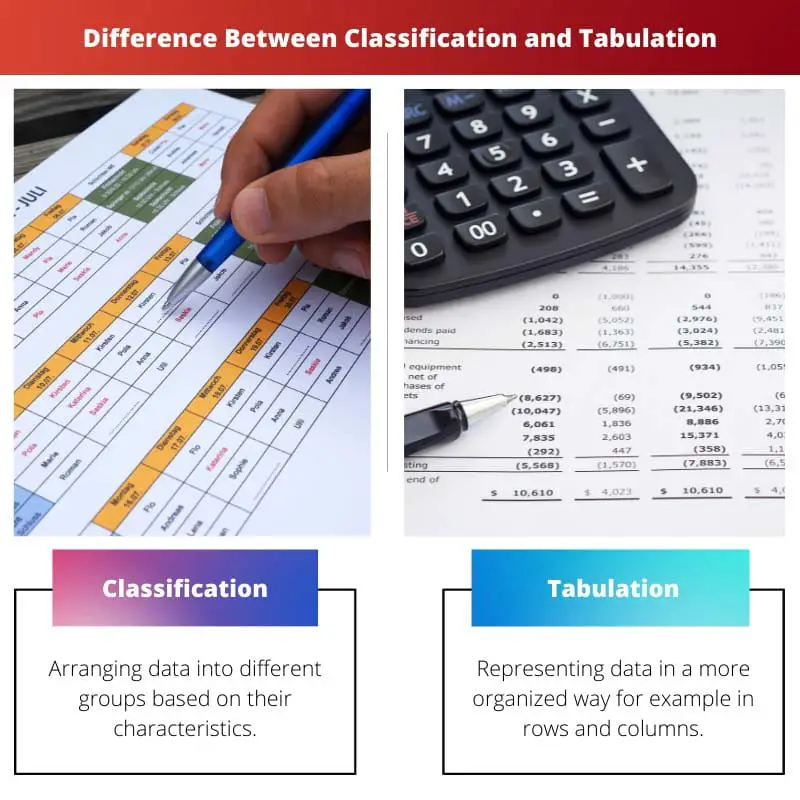
Classification involves grouping data into categories based on common characteristics, while tabulation organizes data into tables or charts to present it in a structured and understandable format.
Key Takeaways
- Classification is categorizing data into groups based on their characteristics or attributes.
- Tabulation is organizing and presenting data in a table or chart.
- Classification is a method of data analysis, while tabulation is a method of data presentation.
Classification vs Tabulation
“Classification” means to divide the data into various categories, and tabulation means to put the data in a tabular form. Classification is made after data collection, while tabulation is made after classification.
After the process of collecting data is done, it then needs to be examined. At this stage, the data is raw, and for it to be ready for analysis, it needs to undergo a process of editing.
After editing, the data needs to be coded carefully. After the data has been coded, it needs to be classified and tabulated, where we represent it in tables consisting of rows and columns.
For an average person, classification and tabulation may seem similar, but they are different. Classification means arranging data in a group, whereas tabulation represents data in rows and columns.
Comparison Table
| Feature | Classification | Tabulation |
|---|---|---|
| Definition | The process of grouping data into categories based on shared characteristics. | The process of presenting classified data in a structured, organized table format. |
| Purpose | To organize and analyze data, identify patterns, and facilitate understanding. | To present data in a clear, concise, and easily understandable way. |
| Method | Data is grouped based on specific criteria, such as age, gender, income, or location. | Data is organized into rows and columns, with categories listed in headings and subheadings, and data values placed in corresponding cells. |
| Output | A list of categories and the number of items belonging to each category. | A table with rows and columns displaying the classified data. |
| Benefits | Enables identification of similarities and differences between groups, simplifies data analysis, and helps draw conclusions. | Makes data more understandable and visually appealing, facilitates data comparison, and aids in summarizing information. |
| Limitations | May overlook subtle differences within categories, can be subjective depending on chosen criteria, and may not reveal complex relationships between variables. | Can be cumbersome for large datasets, may not be suitable for complex data analysis, and may not reveal underlying patterns. |
| Examples | Classifying customers by age group, classifying products by category, classifying employees by job title. | Creating a table of student grades by subject, creating a table of product sales by region, creating a table of voting results by precinct. |
What is Classification?
Classification is the process of organizing data into groups based on shared characteristics. It is a fundamental data analysis technique in various fields, including statistics, machine learning, and everyday life.
Here are the key elements of classification:
- Data: The collection of information to be analyzed.
- Characteristics: The attributes or features of the data that are used to categorize it.
- Criteria: The specific rules or guidelines used to determine an item’s category.
- Categories: The distinct groups into which the data is organized.
- Classification method: The specific algorithm or technique used to perform the classification.
Here are some common classification methods:
- Rule-based classification: Uses a set of predefined rules to assign data to categories.
- Decision tree: Classifies data by asking questions based on specific features.
- K-nearest neighbors (KNN): Classifies data based on its features’ similarity to other data points’ features.
- Naive Bayes: Classifies data based on the probability of different categories given the observed features.
- Support vector machines (SVM): Classifies data by finding the best hyperplane that separates different categories.
Benefits of classification:
- Identify patterns and trends: Helps identify patterns and trends in the data that would be difficult to see without classification.
- Simplify data analysis: Simplifies data analysis by reducing the data into smaller, more manageable categories.
- Make predictions: Can be used to make predictions about new data points based on their similarity to existing data points.
- Support decision-making: Helps inform decision-making by providing insights into the data and highlighting key differences between groups.
Limitations of classification:
- Subjectivity: The choice of classification criteria can be subjective and influence the results.
- Overfitting: Classification models can overfit the training data, leading to poor performance on unseen data.
- Data quality dependent: The effectiveness of classification depends on the quality and completeness of the data.
- Limited to categorical data: Certain classification methods are limited to categorical data and may not be suitable for continuous data.
Examples of classification in everyday life:
- Classifying emails as spam or not spam.
- Grouping customers by age, gender, or income.
- Categorizing images as dogs or cats.
- Predicting whether a loan applicant is likely to default.
- Identifying fraudulent transactions.
What is Tabulation?
Tabulation is the process of presenting classified data in a structured, organized table format. It involves arranging data in rows and columns, with categories listed in headings and subheadings, and data values placed in corresponding cells.
Here are the key features of tabulation:
- Classified data: The data must be classified into categories based on shared characteristics.
- Table format: The data is organized in rows and columns for easy identification and comparison.
- Headings and subheadings: Headings and subheadings identify the categories and data types in the table.
- Data values: The actual data values are placed in corresponding cells within the table.
- Additional elements: Titles, footers, and annotations can be added to provide context and explanation.
Benefits of tabulation:
- Clear and concise presentation: Makes data more understandable and visually appealing, facilitating comprehension and interpretation.
- Easy data comparison: Enables comparison of data points across different categories and subcategories.
- Summarization of information: Helps summarize large amounts of data in a compact and organized format.
- Visualization of trends: Can be used to visualize trends and patterns within the data.
- Increased accessibility: Makes data easier to share and collaborate on with others.
Limitations of tabulation:
- Complexity for large datasets: Tabulation can become cumbersome for large datasets, requiring additional techniques for effective presentation.
- Limited insight into complex relationships: While effectively summarizing data, tabulation may not reveal underlying relationships between variables.
- Potential for misinterpretation: Improper table formatting or unclear headings can lead to misinterpretations of the data.
Examples of tabulation in everyday life:
- Creating a grade table for students in a class.
- Presenting sales figures for different products or regions.
- Comparing voting results across different precincts.
- Organizing financial data for budgeting and analysis.
- Creating a schedule with appointments and deadlines.

Main Differences Between Classification and Tabulation
- Nature:
- Classification: Classification involves categorizing data into distinct groups or classes based on shared characteristics or criteria, creating classes or categories.
- Tabulation: Tabulation involves organizing data into tables, charts, or summary formats to present it systematically, focusing on the arrangement and display of data.
- Process:
- Classification: Classification is sorting and grouping data into meaningful categories or classes, simplifying and organizing complex data.
- Tabulation: Tabulation is a process of summarizing and arranging data in a structured format, using rows and columns to display data clearly and concisely.
- Output:
- Classification: The output of classification is the creation of distinct categories or classes that help organize and understand the data better.
- Tabulation: The output of tabulation is the presentation of data in tables, charts, or graphs, making it easier to analyze and interpret.
- Purpose:
- Classification: Classification aims to combine similar data elements to facilitate analysis, comparisons, and decision-making.
- Tabulation: Tabulation aims to present data in a structured and organized format to provide a visual summary that enhances data interpretation.
- Use of Categories:
- Classification: Classification involves defining and creating categories or classes to which data elements are assigned based on specific criteria or attributes.
- Tabulation: Tabulation utilizes these predefined categories or classes to organize data systematically and display it effectively.
- Flexibility:
- Classification: Classification can be more flexible in defining categories and adapting to changing data requirements.
- Tabulation: Tabulation is more structured and may follow predefined formats, making it less flexible in layout and presentation.
- Analysis vs. Presentation:
- Classification: Classification primarily aids in data analysis by grouping similar data together for meaningful comparisons and insights.
- Tabulation: Tabulation primarily focuses on presenting data in an organized and easily understandable format, facilitating communication.
- https://homework1.com/statistics-homework-help/types-of-classification/
- https://www.emathzone.com/tutorials/basic-statistics/tabulation-of-data.html
- https://www.ncbi.nlm.nih.gov/pmc/articles/PMC2329462/pdf/pubhealthpap00029-0488.pdf

The comparison table is well-structured and greatly aids in highlighting the differences between classification and tabulation in a clear, concise manner.
I couldn’t agree more, the tabular format effectively underscores the disparities between classification and tabulation.
Absolutely, the visual representation provided by the comparison table is a standout feature of this article.
This article provides a comprehensive breakdown of the differences between classification and tabulation, and it is certainly instructive for those seeking to delve deeper into data analysis methods.
I completely agree, the definitions and examples provided here really help clarify the distinction between the two methods.
Indeed, the article does an excellent job of outlining the key elements of classification and tabulation, making it easier for readers to comprehend.
The article does a commendable job of unraveling the intricacies of classification and tabulation, greatly contributing to a deeper comprehension of these data analysis methods.
I concur, the thorough exploration of classification and tabulation is indeed beneficial for those wanting to expand their knowledge in this area.
The comprehensive overview of classification and tabulation methods provides a solid foundation for understanding the significance and applications of these data analysis techniques.
I agree, this article is a great starting point for anyone seeking an in-depth understanding of classification and tabulation.
Indeed, the article effectively demystifies the complexities of classification and tabulation, clarifying their roles in data analysis.
The comparative analysis of classification and tabulation is indeed enlightening, offering readers a comprehensive guide to comprehending these essential data organization processes.
I completely agree, the article effectively elucidates the nuances of classification and tabulation, fostering a deeper understanding of these methods.
Although the article touches on the benefits of classification and tabulation, a more detailed analysis of the practical applications of these methods would be enlightening.
I understand your point. Real-world examples would indeed enhance the understanding of classification and tabulation’s significance.
The information provided is quite helpful, but the limitations of classification and tabulation could have been discussed in more depth.
I have to agree, further exploration of the potential limitations would have made for a more well-rounded overview.
The breakdown of classification and tabulation methods is insightful, presenting a valuable resource for those interested in understanding these data organization techniques.
Absolutely, the detailed explanation of classification and tabulation provides a strong foundation for readers looking to explore these concepts further.
While the article sheds light on the key elements of classification and tabulation, delving into the historical context and development of these methods could add further depth.
I share your view. Exploring the origins and evolution of classification and tabulation would provide valuable context to readers.
Absolutely, a historical perspective would undoubtedly enrich the understanding of these vital data analysis techniques.
The detailed comparison of classification and tabulation serves as an intellectual guide for those navigating the intricacies of data organization and presentation.
Well said, the nuanced examination of classification and tabulation is undeniably beneficial for readers looking to expand their knowledge in this field.