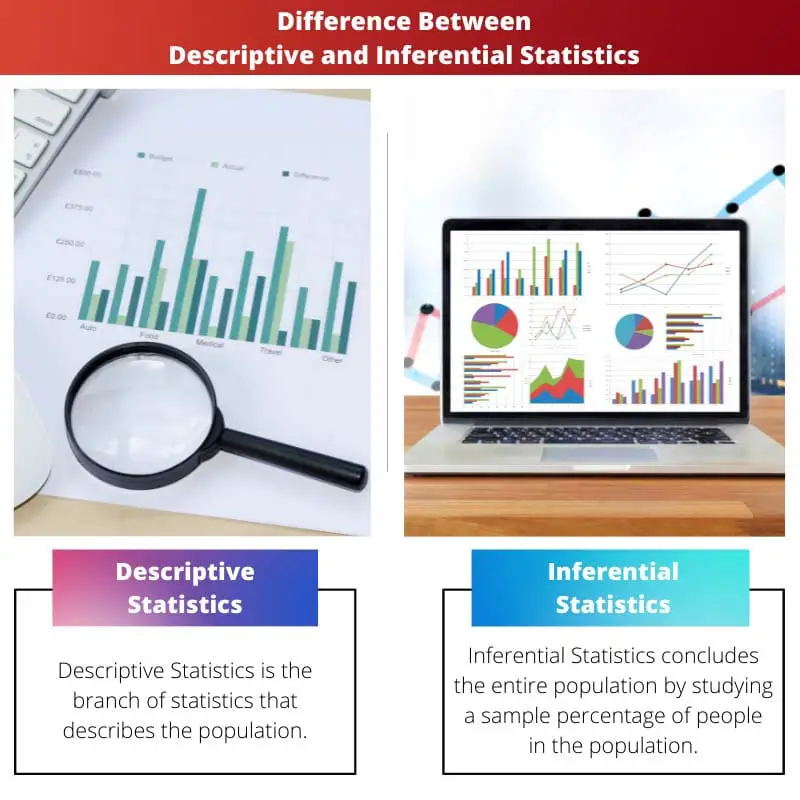
Descriptive statistics summarize and describe the main features of a dataset, providing simple and meaningful insights. Inferential statistics draw conclusions or make predictions about a population based on a sample of data, using probability theory and hypothesis testing. Together, they help analysts understand and interpret the characteristics of data.
Key Takeaways
- Descriptive statistics summarize and describe the main features of a dataset, while inferential statistics use sample data to make predictions or draw conclusions about a population.
- Descriptive statistics include central tendency and dispersion measures, while inferential statistics involve hypothesis testing and estimation techniques.
- Descriptive statistics provide a foundation for data analysis, while inferential statistics allow researchers to make data-driven decisions and predictions.
Descriptive vs Inferential Statistics
Descriptive statistics summarizes and describes the main features of a dataset, such as the mean, median, and standard deviation. It provides a way to understand the distribution and pattern of data. Inferential statistics uses a sample of data to make inferences about the population from which the data was drawn.
Comparison Table
| Feature | Descriptive Statistics | Inferential Statistics |
|---|---|---|
| Purpose | Describe the characteristics of a data set | Draw conclusions about a population based on a sample |
| Focus | Data itself | Population being represented by the data |
| Information provided | Measures of central tendency, dispersion, and distribution | Confidence intervals, p-values, hypothesis tests |
| Sample size | Applicable to any size | Usually relies on samples, but can be applied to small populations |
| Certainty | Summarizes known data | Makes predictions or generalizations with an inherent level of uncertainty |
| Examples | Mean, median, mode, range, standard deviation, frequency distribution | Hypothesis testing, correlation analysis, regression analysis, ANOVA |
| Output | Charts, tables, graphs | Statements about the population with a probability of being true |
| Limitations | Cannot generalize beyond the data set | Requires careful sample selection and valid statistical tests |
What is Descriptive Statistics?
Descriptive statistics involve methods of organizing, summarizing, and presenting data in a meaningful way. These statistical techniques aim to provide a clear and concise overview of the main features and characteristics of a dataset. Descriptive statistics do not involve making inferences or generalizations about a larger population; instead, their primary purpose is to offer insights into the specific dataset being analyzed.
Measures of Central Tendency
Descriptive statistics include measures of central tendency, such as the mean, median, and mode. These measures provide a central or representative value around which the data points cluster, offering a sense of the dataset’s typical value.
Measures of Dispersion
Another aspect of descriptive statistics involves measures of dispersion, such as the range, variance, and standard deviation. These measures help assess the spread or variability of the data points, providing information about how much individual data values deviate from the central tendency.
Data Visualization
Descriptive statistics are frequently complemented by visual representations of data, including histograms, box plots, and scatter plots. These visualizations enhance the understanding of the data’s distribution, patterns, and potential outliers.

What is Inferential Statistics?
Inferential statistics involves drawing conclusions or making inferences about a population based on a sample of data. This branch of statistics utilizes probability theory and hypothesis testing to extrapolate findings beyond the observed sample.
Key Concepts:
- Population and Sample:
- Population: The entire group under study.
- Sample: A subset of the population used to gather data.
- Sampling Methods:
- Random Sampling: Each member of the population has an equal chance of being included in the sample.
- Stratified Sampling: The population is divided into subgroups, and samples are taken from each subgroup.
- Cluster Sampling: The population is divided into clusters, and entire clusters are randomly selected.
- Hypothesis Testing:
- Null Hypothesis (H0): A statement of no effect or no difference.
- Alternative Hypothesis (H1): A statement indicating an effect or difference.
- Significance Level (α): The probability of rejecting the null hypothesis when it is true (set at 0.05).
- P-value: The probability of obtaining observed results, or more extreme, assuming the null hypothesis is true. A lower p-value suggests stronger evidence against the null hypothesis.
- Confidence Intervals:
- A range of values calculated from the sample data, within which the true population parameter is likely to fall with a certain level of confidence (e.g., 95%).
- Regression Analysis:
- Examining the relationship between variables to predict or explain outcomes.
- Statistical Inference Techniques:
- T-tests: Used to compare means of two groups.
- ANOVA (Analysis of Variance): Compares means of more than two groups.
- Regression Analysis: Predicts the relationship between dependent and independent variables.
- Errors in Inference:
- Type I Error: Incorrectly rejecting a true null hypothesis.
- Type II Error: Failing to reject a false null hypothesis.

Main Differences Between Descriptive and Inferential Statistics
- Scope:
- Descriptive Statistics: Summarizes and describes the main features of a dataset.
- Inferential Statistics: Draws conclusions or makes predictions about a population based on a sample.
- Objective:
- Descriptive Statistics: Provides insights into the characteristics of the data.
- Inferential Statistics: Extrapolates findings from a sample to make inferences about a population.
- Data Analysis:
- Descriptive Statistics: Focuses on organizing and summarizing data using measures such as mean, median, and standard deviation.
- Inferential Statistics: Involves hypothesis testing, confidence intervals, and regression analysis to make predictions or draw conclusions about a population.
- Example Techniques:
- Descriptive Statistics: Mean, median, mode, range, standard deviation.
- Inferential Statistics: Hypothesis testing, confidence intervals, regression analysis, t-tests, ANOVA.
- Purpose:
- Descriptive Statistics: Provides a snapshot and overview of the dataset.
- Inferential Statistics: Aims to make generalizations or predictions about a population based on sample data.
- Population vs. Sample:
- Descriptive Statistics: Focuses on the characteristics of the observed sample.
- Inferential Statistics: Involves making inferences about the larger population from which the sample is drawn.
- Application:
- Descriptive Statistics: Commonly used for summarizing and presenting data in a meaningful way.
- Inferential Statistics: Essential for making predictions, drawing conclusions, and making decisions beyond the observed data.
- Example Scenario:
- Descriptive Statistics: Calculating the average income of a sample.
- Inferential Statistics: Predicting the average income of the entire population based on the sample data.
- https://repository.upenn.edu/cgi/viewcontent.cgi?article=1314&context=marketing_papers
- https://journals.library.ualberta.ca/eblip/index.php/EBLIP/article/view/168
- https://psycnet.apa.org/record/1994-98130-000
- https://arxiv.org/abs/1302.2525
Last Updated : 11 February, 2024

Chara Yadav holds MBA in Finance. Her goal is to simplify finance-related topics. She has worked in finance for about 25 years. She has held multiple finance and banking classes for business schools and communities. Read more at her bio page.


Descriptive and inferential statistics are essential for understanding and interpreting data. Descriptive statistics summarize the data’s main features, while inferential statistics allows us to make predictions about a larger population.
You’re absolutely right! These statistical methods are foundational for data analysis and decision-making.
Descriptive statistics and inferential statistics serve distinct yet complementary purposes in data analysis. Understanding their differences enhances the clarity of interpreting data.
Absolutely, Barry. Both aspects are indispensable for deriving valuable insights from data.
The article provides a comprehensive overview of descriptive and inferential statistics, highlighting their key differences and purposes. This clarity is invaluable for analysts and researchers.
Absolutely, Devans. A solid grasp of these statistical methods is fundamental in various fields, from research to business analytics.
I couldn’t agree more. This distinction is crucial in ensuring the accuracy and reliability of data-driven insights.
The distinction between descriptive and inferential statistics is clear. While descriptive statistics summarize the characteristics of a dataset, inferential statistics allow us to generalize and make predictions about a larger population.
Well said, David. The synergy between these statistical methods is fundamental for comprehensive data analysis.
The article provides a clear and concise explanation of descriptive and inferential statistics, shedding light on their distinct yet complementary roles in data analysis.
Descriptive and inferential statistics are like the yin and yang of data analysis, each crucial in its own way for meaningful interpretations and predictions.
Descriptive statistics offer a comprehensive view of the dataset, while inferential statistics take us beyond the observed sample to make broader inferences about the entire population.
It’s fascinating how these statistical methods complement each other to provide a comprehensive understanding of data.
Absolutely! Both descriptive and inferential statistics are essential for extracting meaningful insights from data.
It’s crucial to have a thorough understanding of descriptive and inferential statistics to extract meaningful insights and draw accurate conclusions from data.
Indeed, Tina. Both aspects are vital for sound and effective data interpretation and decision-making.
The comparison between descriptive and inferential statistics is illuminating. It’s crucial to understand the purpose and scope of each to utilize them effectively.
Absolutely. Clarity on descriptive and inferential statistics is foundational for any data analyst or researcher.
I couldn’t agree more. Without a solid grasp of these statistical methods, data analysis can be misleading.
The distinction between descriptive and inferential statistics is crucial. Descriptive statistics provide a solid foundation for data analysis, while inferential statistics allow for broader generalizations and predictions.
Indeed, the ability to draw conclusions about a population based on a sample is invaluable in research and decision-making processes.