When entering the business world, you are expected to follow a set of terms, rules, agenda and strategy if you want to have a flourishing business.
There are technicalities and plots on which you need to establish your grounds in business. To maintain a strict record of your investments/assets, you must understand and abide by certain formulas to run a risk-free business.
You need to understand shares, market business, rates, profit and loss, returns, etc. CML and SML are two prominent features you need to understand to get a good grasp on growing business.
You must now be wondering what these terms are and how they will help maintain your charts in business. Let’s elaborately clarify your doubts.
Key Takeaways
- CML (Capital Market Line) represents the relationship between expected return and total risk (standard deviation) for efficient portfolios, including the risk-free asset.
- SML (Security Market Line) represents the relationship between expected return and systematic risk (beta) for individual securities or portfolios.
- Both CML and SML are used in modern portfolio theory to evaluate investment performance, but they assess risk differently and are applied to distinct types of assets or portfolios.
CML vs SML
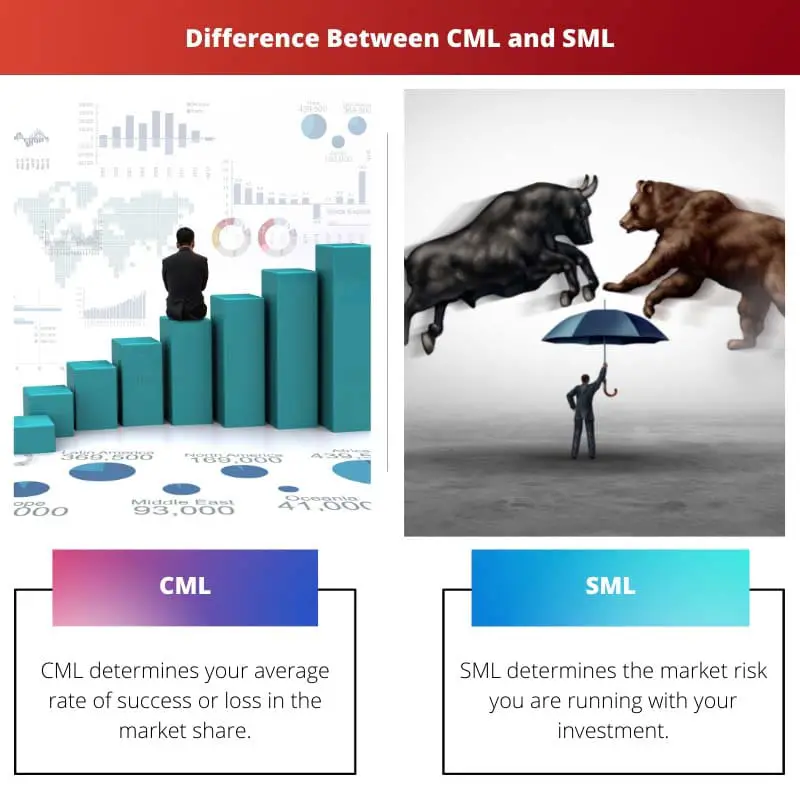
The difference between CML and SML is that CML primarily determines your average rate of success or loss in the market share, whereas SML determines the market risk you are running with your investment. It shows a point or degree beyond which you might run a risk with your shares.

CML stands for Capital Market Line. It tells you at what rate your input is returning you values. In common words, it determines the degree of your profit in the market as per your investment.
SML stands for Security Market Line. This is also a line in the graph determining your rate of return, but there’s a catch in this one. Here, the SML tells you about the market’s risk or that point in the graph which shows that your profits might be running at risk.
It is the marginal expected returns for your investment or shares. However, some people find it more convenient to refer to the CML for measuring the risk factors.
Comparison Table
| Parameters of Comparison | CML | SML |
|---|---|---|
| Full form | Capital Market Line | Security Market Line |
| Definition | CML determines your average rate of success or loss in the market share. | SML determines the market risk you are running with your investment. |
| Portfolios | Defines functioning portfolios. | Defines both functioning and non-functioning portfolios. |
| Functioning | More efficient. | Less efficient. |
| Agenda | To describe only market portfolios and risk-free investments. | To describe overall security factors. |
What is CML?
CML stands for Capital Market Line. CML tells you at what rate your input is returning your values, which is your average business growth rate.
The line on the graph shows the extra returns an investor gets for his investments for a given level of risk he opts for.
Investors who are well-acquainted in the line of business put up large shares and expect good returns for their assets which the capital market line exhibits graphically.
In common words, it determines the degree of your profit in the market as per your investment. CML primarily shows the trade-off between risk and return for functioning portfolios. It very efficiently depicts the combined risk-free returns of all the portfolios.
People deduce that you should invest in buying shares if the quick ratio is above CML. However, if the quick ratio is below CML, you should sell your shares/assets.

What is SML?
SML stands for Security Market Line. This is also a line in the graph determining your rate of return, but there’s a catch in this one. Here, the SML tells you about the market’s risk or that point in the graph which shows that your profits might be running at risk.
Fundamental businessmen/women use CAPM to keep track of risk premiums, detect corporate finance decisions, see undervalued and overvalued investments and compare various based on diverse sectors.
Market economists use SMLs to understand and determine an investor’s behaviours in the investment line. Investors aim to amplify expected returns parallel to market risks.
Most importantly, SML determines whether more assets/investments can be added to the existing market portfolio.
The risk running individually in these diverse market portfolios tells the investor about his undervalued and overvalued investments; thus, this system of calculation is known as systematic risk.

Main Differences Between CML and SML
- The full form of CML is Capital Market Line. The full form of SML is Security Market Line.
- CML determines your average rate of success or loss in the market portfolio. SML defines the market risk you are running with your investment.
- Defines functioning portfolios. Defines both functioning portfolios and non-functioning portfolios.
- CML is more efficient than SML.
- The agenda is to describe only market portfolios and risk-free investments. At the same time, SML’s agenda is to describe the overall security factors.

- https://link.springer.com/article/10.1007/s00199-005-0638-1
- https://onlinelibrary.wiley.com/doi/abs/10.1111/j.1540-6261.1985.tb04963.x