Correlation measures the strength and direction of the relationship between two variables, indicating how they move together. Regression, on the other hand, models the relationship between variables, allowing for prediction and understanding of how changes in one variable affect another, including quantifying the impact through coefficients and intercepts.
Key Takeaways
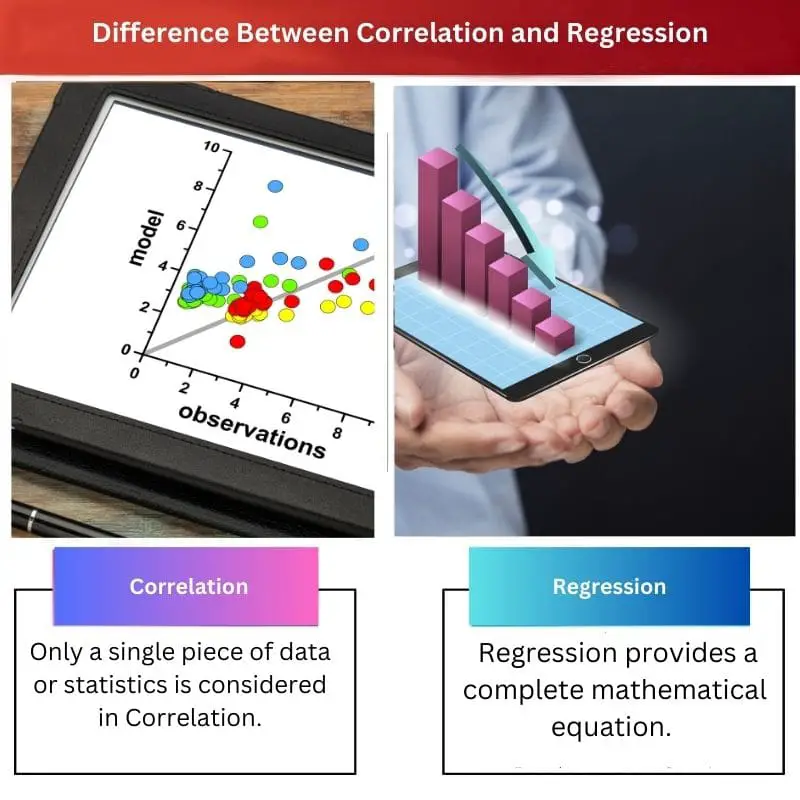
- Correlation measures the strength and direction of the relationship between two variables, while regression is used to predict the value of one variable based on the value of another.
- Correlation does not imply causation, while regression can help identify causal relationships.
- Correlation can be calculated using a simple formula, while regression requires more complex mathematical models.
Correlation vs Regression
Correlation refers to the degree of association between two variables. Regression is used to model the relationship between two variables. Correlation measures the degree of association between two variables, while regression models the relationship between two variables.
The relationship between the two different variables was initially assessed. Regression has countless intuitive applications in the day to day life. Here is a thorough comparison table that can successfully explain the differences between the two terms.
Comparison Table
| Feature | Correlation | Regression |
|---|---|---|
| Purpose | Measures the strength and direction of the relationship between two variables | Models the dependence of one variable (dependent) on another variable (independent) |
| Output | A single coefficient (r) ranging from -1 to 1 (-1: perfect negative, 0: no relationship, 1: perfect positive) | An equation or model that predicts the value of the dependent variable based on the independent variable |
| Causality | Does not imply causation | Can suggest causation, but requires further analysis to confirm |
| Assumptions | Requires linearity and homoscedasticity (equal variance) of the data | More stringent assumptions, including normality of residuals (errors) |
| Applications | Identifying trends, understanding relationships, exploring data | Predicting future values, making forecasts, making decisions based on model predictions |
| Examples | Studying the correlation between temperature and ice cream sales | Building a model to predict house prices based on size and location |
What is Correlation?
Correlation is a statistical measure that quantifies the strength and direction of the relationship between two quantitative variables. It assesses how changes in one variable are associated with changes in another variable.
Types of Correlation
- Positive Correlation: When both variables move in the same direction. That is, as one variable increases, the other variable also tends to increase, and vice versa. For example, there might be a positive correlation between the number of hours studied and exam scores.
- Negative Correlation: When variables move in opposite directions. This means that as one variable increases, the other variable tends to decrease, and vice versa. An example could be the relationship between temperature and winter clothing sales.
- Zero Correlation: When there is no apparent relationship between the variables. Changes in one variable do not predict changes in the other. This does not imply that the variables are unrelated, just that their relationship is not linear.
Measuring Correlation
- r = +1 indicates a perfect positive correlation
- r = -1 indicates a perfect negative correlation
- r = 0 indicates no correlation
Other methods for measuring correlation include Spearman’s rank correlation coefficient and Kendall’s tau coefficient, which are used for ordinal data or when the relationship between variables is not linear.
What is Regression?
Regression analysis is a statistical method used to examine the relationship between one dependent variable (denoted as “Y”) and one or more independent variables (denoted as “X”). It allows us to predict the value of the dependent variable based on the values of one or more independent variables.
Types of Regression
- Simple Linear Regression: This involves a single independent variable and a dependent variable. The relationship between the two variables is assumed to be linear, meaning it can be represented by a straight line. For example, predicting house prices based on the size of the house.
- Multiple Linear Regression: This involves more than one independent variable and a dependent variable. It extends simple linear regression to accommodate multiple predictors. For instance, predicting a person’s salary based on their education level, years of experience, and location.
- Polynomial Regression: Polynomial regression models the relationship between the independent variable and the dependent variable as an nth-degree polynomial. It allows for more complex relationships between variables that cannot be captured by linear models.
- Logistic Regression: Unlike linear regression, logistic regression is used when the dependent variable is categorical. It predicts the probability of occurrence of an event by fitting data to a logistic curve. For example, predicting whether a customer will buy a product based on their demographic information.
Steps in Regression Analysis
- Data Collection: Gather data on the variables of interest.
- Data Exploration: Explore the data to understand the relationships between variables, identify outliers, and assess data quality.
- Model Building: Choose the appropriate regression model based on the nature of the data and the research question.
- Model Fitting: Estimate the parameters of the regression model using techniques like least squares or maximum likelihood estimation.
- Model Evaluation: Assess the goodness-of-fit of the model and its predictive accuracy using measures like R-squared, adjusted R-squared, and root mean squared error (RMSE).
- Interpretation: Interpret the coefficients of the regression model to understand the relationships between variables and make predictions or draw conclusions based on the model.
Main Differences Between Correlation and Regression
- Objective:
- Correlation measures the strength and direction of the relationship between two variables.
- Regression models the relationship between variables, allowing for prediction and understanding of how changes in one variable affect another.
- Representation:
- Correlation is represented by a single coefficient (e.g., Pearson’s r), indicating the degree of association between variables.
- Regression involves modeling the relationship between variables through an equation, allowing for predictions and interpretation of the impact of independent variables on the dependent variable.
- Directionality:
- Correlation does not imply causation and does not establish the direction of the relationship between variables.
- Regression allows for assessing causality and understanding the direction of the relationship, distinguishing between independent and dependent variables.
- Application:
- Correlation analysis is used to understand the degree of association between variables and to identify patterns in data.
- Regression analysis is used for prediction, explanation, and hypothesis testing, allowing for the quantification of relationships and the estimation of parameters.
- Output:
- Correlation provides a single coefficient representing the strength and direction of the relationship between variables.
- Regression provides coefficients (slope and intercept) that quantify the relationship between variables and allow for prediction of the dependent variable based on the independent variables.
- https://psycnet.apa.org/record/1960-06763-000
- https://link.springer.com/content/pdf/10.3758/BRM.41.4.1149.pdf
- https://psycnet.apa.org/record/1995-97110-002
Last Updated : 05 March, 2024

Piyush Yadav has spent the past 25 years working as a physicist in the local community. He is a physicist passionate about making science more accessible to our readers. He holds a BSc in Natural Sciences and Post Graduate Diploma in Environmental Science. You can read more about him on his bio page.


The article successfully delineates the nuances between correlation and regression. It’s a valuable resource for those engaged in statistical analysis.
The article presents a comprehensive comparison between correlation and regression, but it could benefit from more real-world examples to illustrate their practical applications.
I agree, real-world scenarios would make the concepts more relatable for readers.
I see your point, Grant. More concrete examples would indeed enhance the article’s usefulness.
The article’s comparison table effectively encapsulates the core disparities between correlation and regression. It greatly aids in understanding their distinct purposes.
Indeed, the comparison table is a standout feature of the article, offering a concise overview of the two statistical concepts.
The article provides a clear and detailed explanation of the differences between correlation and regression. It’s very informative and helpful for those looking to understand these statistical concepts better.
I agree, the comparison table is especially useful for understanding the key differences between correlation and regression.
I found the section on interpreting correlation coefficients to be particularly insightful, especially for those new to statistical analysis.
The article effectively elucidates the differences between correlation and regression. Its clear language makes it accessible even to those unfamiliar with statistical terminology.
I completely agree. The article’s clarity is commendable, especially when tackling complex statistical concepts.
The article could benefit from a more detailed exploration of the limitations of correlation and regression. A deeper analysis of their constraints would provide a more holistic understanding.
I agree, Ruby. A more in-depth discussion of the limitations would enhance the article’s thoroughness.
A nuanced examination of the limitations would indeed add significant value to the article.
The article’s elucidation of correlation and regression is exceptional. The inclusion of practical examples would further amplify its educational value.
I wholeheartedly agree, Louis. Real-world instances would undoubtedly enrich the article’s instructive nature.
The article does a great job of explaining the purpose and applications of correlation and regression. It’s a valuable resource for those studying or working with statistical data.
Absolutely, this article is a must-read for anyone looking to deepen their understanding of these statistical concepts.
The article effectively differentiates between correlation and regression, but some readers may benefit from a more accessible breakdown of the mathematical aspects.
I understand your point, Lauren. A simplified overview of the mathematical elements would cater to a wider audience.
Indeed, a more accessible presentation of the mathematical components would enhance the article’s inclusivity.
The article’s explanation of correlation and regression is impressively thorough and well-structured. It serves as an excellent educational tool for those interested in statistics.