Rows represent individual records or observations, providing a horizontal arrangement of data. On the other hand, columns are used to categorize and display specific attributes or variables, providing a vertical structure for data analysis and comparison.
Key Takeaways
- Rows are horizontal data arrangements in a table or spreadsheet, while columns are vertical data arrangements.
- Rows are numbered from top to bottom, while columns are lettered from left to right.
- Rows are used to classify data according to different attributes, while columns are used for similar group types of data.
Rows vs Columns
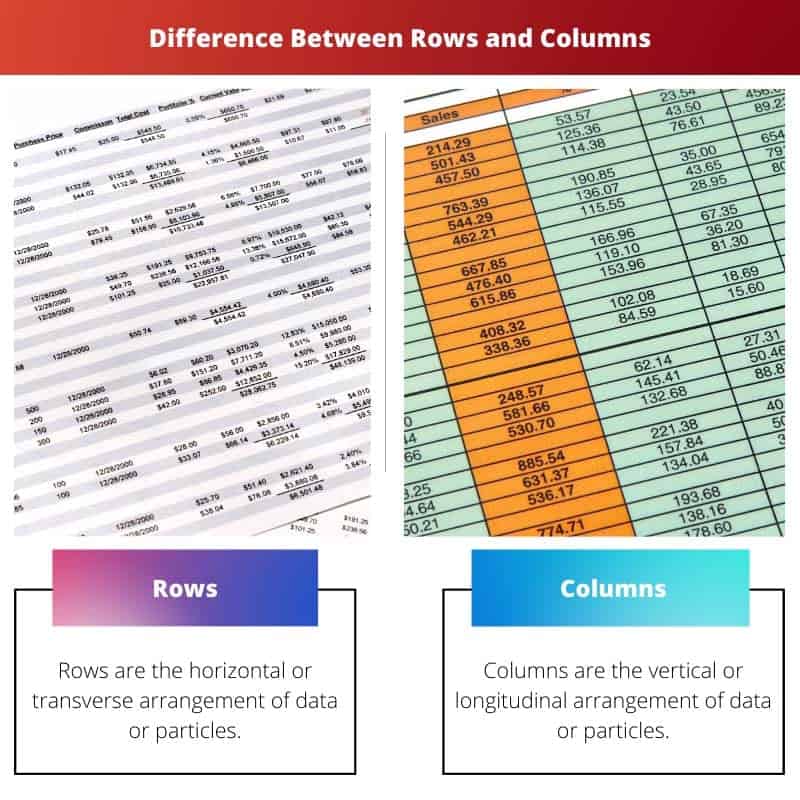
The difference between rows and columns is that rows are the horizontal or transverse arrangement of particles, data, or cells. In contrast, columns are the vertical or longitudinal arrangement of particles, data, or cells. The particles in a row are aligned from left to right, while the particles in a column are aligned from top to bottom. In a spreadsheet, the total, if shown, is shown at the extreme right side in the case of rows, while it is shown at the extreme bottom in the case of columns.
The extreme left part of a table is called a stub, which indicates the rows, while the extreme top part is called a caption and describes the columns. Rows are also known as records, as in Database Management or horizontal arrays, in the case of matrices. At the same time, columns are also known as fields, as in Database Management, or vertical arrays, as in matrices. Numbers represent rows, while alphabets represent columns.
Comparison Table
| Feature | Rows | Columns |
|---|---|---|
| Orientation | Horizontal (left to right) | Vertical (top to bottom) |
| Data Type | Individual record | Category or attribute |
| Representation | Numbers or letters | Headers or labels |
| Analysis | Comparison between different cases | Comparison within the same variable |
| Operations | Sorting, filtering, grouping | Aggregating, calculating, analyzing |
| Flexibility | Number of rows can be dynamic | Number of columns is fixed |
| Perspective | Horizontal (individual entity) | Vertical (specific attribute) |
What are Rows?
In the context of tables, a “row” refers to a horizontal arrangement of data or information within the table structure. Rows run horizontally across the table and are commonly used to organize and display related sets of data. Each row consists of cells that intersect with columns, forming a grid-like pattern.
Components of a Row
- Cells:
- A row is composed of individual cells, each of which represents a unit of data.
- Cells are formed at the intersection of rows and columns, creating a matrix-like structure.
- Data Entries:
- The actual information or data is entered into the cells within a row.
- Data entries in a row are organized based on the corresponding column headers.
- Row Header:
- Some tables include a row header, designating the purpose or category of the data in that particular row.
- The row header provides context and helps users understand the meaning of the data in the row.
Key Characteristics of Rows
- Horizontal Alignment:
- Rows extend horizontally from the leftmost column to the rightmost column of the table.
- Data is organized from left to right within a row.
- Consistency:
- Rows maintain a consistent structure throughout the table, with each row containing the same number of cells as the total number of columns.
- Relationship with Columns:
- Rows and columns work together to create a systematic arrangement of data.
- The intersection of a row and a column is referred to as a cell, where specific data is placed.

What are Columns?
In the context of tables, columns refer to the vertical divisions within the table structure. They play a crucial role in organizing and presenting data in a tabular format. Each column contains data of a specific type or category, allowing for a structured representation of information. Let’s delve into the details of columns in tables.
Structure of Columns
Columns are defined by vertical lines in a table, and each column has a header that describes the type of data it contains. The headers are placed at the top of the table, providing a quick reference for the content within each column. For example, in a table representing a student database, columns might include “Student ID,” “Name,” “Age,” and “Grade.”
Characteristics of Columns
- Header: As mentioned, each column has a header that serves as a label for the type of data stored in that column. The header is placed at the top of the column.
- Data Cells: The actual data entries for each category or type are listed in the cells beneath the header within the column. These cells contain the specific information related to the corresponding header.
- Vertical Alignment: Columns align vertically, allowing for easy comparison of data within the same category. This alignment aids in quickly scanning and understanding the information presented in the table.
- Width and Spacing: Columns can vary in width based on the amount of data they need to accommodate. Proper spacing between columns enhances the overall readability of the table.
Utilizing Columns Effectively
- Consistency: Maintain consistency in the formatting and content of each column to ensure a clear and organized presentation of data.
- Alignment: Align the data within each column uniformly. Common alignment options include left, center, and right alignment, depending on the type of data.
- Sorting: Columns can be used to sort and organize data. For instance, a table of sales data could be sorted based on the “Revenue” column to identify the highest and lowest performing items.
- Mathematical Operations: Columns are used for mathematical operations, such as calculating totals or averages. For example, a “Total” column might be added to calculate the sum of numerical data in other columns.

Main Differences Between Rows and Columns
Rows:
- Horizontal arrangement of data or elements in a table, spreadsheet, or grid.
- Represents a single entry or record in a dataset.
- Identified by numbers in Excel (e.g., 1, 2, 3) and letters in databases (e.g., A, B, C).
- Typically contains related information about a particular item or entity.
- Reading from left to right provides information about a specific data point across various categories or attributes.
- Commonly used to organize and compare data horizontally.
Columns:
- Vertical arrangement of data or elements in a table, spreadsheet, or grid.
- Represents a specific attribute or category in a dataset.
- Identified by letters in Excel (e.g., A, B, C) and numbers in databases (e.g., 1, 2, 3).
- Typically contains values for a specific attribute across multiple entries or records.
- Reading from top to bottom provides information about a specific attribute for various items or entities.
- Commonly used to organize and compare data vertically.
- https://dl.acm.org/doi/abs/10.1145/1376616.1376712
- https://www.tandfonline.com/doi/abs/10.1080/02602938.2019.1616671
- https://www.sciencedirect.com/science/article/pii/S1388245710000738
Last Updated : 02 March, 2024


Emma Smith holds an MA degree in English from Irvine Valley College. She has been a Journalist since 2002, writing articles on the English language, Sports, and Law. Read more about me on her bio page.


I appreciate how the examples provided make it easier to understand the concept of rows and columns. Thanks for simplifying the technical aspect of this topic.
Totally, the real-life examples help in visualizing the abstract definition of these terms. Great article!
The distinctions between rows and columns are very well-delineated. The visual representations complement the textual explanations nicely.
Absolutely, the inclusion of visual aids enhances the understanding of the topic. It’s an exemplary piece of writing.
This article is quite enlightening. The real-life examples add a refreshing touch to an otherwise technical concept. Great work!
Absolutely! The practical illustrations certainly make the topic more engaging. It’s a well-articulated piece.
This post presents a detailed comparative analysis of rows and columns. The practical examples resonate well with readers, making the content relatable.
Certainly, the real-life analogies used in the post make it easily comprehensible. The engaging content elevates the reading experience.
I agree. The relatable examples make the post captivating and add depth to the understanding of rows and columns.
A very well-explained article about the difference between rows and columns. It is very informative for anyone who is new to this topic.
Definitely, the post explains it in a very clear and comprehensible way. Thanks for the detailed information.
The article provides an insightful discussion on rows and columns. The lucid explanations and comprehensive illustrations enrich the readers’ understanding.
I concur. The article is exceptionally informative, and the clarity of explanation adds immense value to the content.
Absolutely, the lucid writing style and detailed explanations make the content an engaging and beneficial resource for the audience.
The post provides a comprehensive understanding of rows and columns, delving deep into their representation and significance. Informative and insightful!
Indeed, the article offers an extensive insight into the nuances of rows and columns, making it an enriching read.
I couldn’t agree more. The depth of information provided is truly impressive and beneficial for readers.
I think the detailed explanation of what rows and columns are, along with how they are represented, is an excellent way to help readers understand the concepts.
I couldn’t agree more. The post provides a thorough understanding of rows and columns and their significance.
The explanation of real-life applications of rows and columns is quite intriguing. It’s an engaging read for those interested in data representation.
Indeed, the post captures the essence of rows and columns exceptionally. It’s thought-provoking and informative.
I couldn’t agree more. The attention to real-life scenarios is commendable and makes the post very relatable.
The comprehensive comparison table in the post makes it very clear for the readers to grasp the differences between rows and columns. Well-done!
Yes, the comparison table is indeed a fantastic addition to the article. It sums up the information very effectively.
I agree, the visual representation in the comparison table is extremely helpful. I had a great learning experience.