- Enter your data values separated by commas in the "Enter Data" field.
- Select the calculation type (Sample or Population) using the radio buttons.
- Click "Calculate" to calculate the variance.
- View the results, mean (average), data visualization, calculation history, and calculation steps below.
- Click "Clear" to reset the tool and enter new data.
- Click "Copy Results" to copy the calculated variance to the clipboard.
Variance is a statistical measure that describes how much the data in a set varies from the mean value. It is an important concept in statistics and probability theory. The variance calculator is a tool that helps calculate the variance of a set of data. In this article, we will discuss the concepts, formulae, benefits, interesting facts, and use cases of the variance calculator.
Concepts
The variance of a set of data is calculated by taking the average of the squared differences between each data point and the mean value. The formula for calculating variance is as follows:

where:
- σ2 is the variance
- xi is the value of the i-th data point
- μ is the mean value of all data points
- n is the total number of data points
The variance tells us how spread out the data is from the mean value. A high variance indicates that the data points are far from the mean value, while a low variance indicates that the data points are close to the mean value.
Formulae
The variance calculator uses two different formulae for calculating variance depending on whether you have data from a whole population or a sample.
Population Variance
When you have collected data from every member of the population that you’re interested in, you can get an exact value for population variance. The population variance formula looks like this:
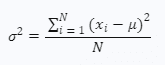
where:
- σ2 is the population variance
- xi is the value of the i-th data point
- μ is the mean value of all data points in the population
- N is the total number of data points in the population
Sample Variance
When you collect data from a sample, you use sample variance to make estimates or inferences about population variance. The sample variance formula looks like this:
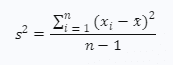
where:
- s2 is the sample variance
- xi is the value of the i-th data point
- xˉ is the mean value of all data points in the sample
- n is the total number of data points in the sample
Benefits
The variance calculator has several benefits:
- It helps to identify how spread out a set of data is.
- It provides an estimate of how much variation there is in a set of data.
- It helps to identify outliers in a set of data.
- It helps to identify patterns in a set of data.
Interesting Facts
Here are some interesting facts about variance:
- Variance was first introduced by Ronald Fisher in 1918.
- Variance can be used to calculate standard deviation.
- Variance can be used to calculate covariance.
Use Cases
Here are some use cases for variance:
- In finance, it can be used to measure risk.
- In physics, it can be used to measure uncertainty.
- In biology, it can be used to measure genetic variation.
