A T-test is a statistical tool used for hypothesis testing to compare the mean of two sets of observed data and determine their difference rate.
It falls within the ambit of inferential statistics, the branch concerned with making predictions and generalisations regarding a given population by picking up a sample.
Unlike in Z-test, the sample size in a T-test should be less than 30, and the standard deviation should be unknown.
Key Takeaways
- The T-test is a statistical test used to determine whether the means of two data groups are significantly different from each other.
- The T-test is commonly used in scientific research to analyze the results of experiments or surveys and to draw conclusions about the population from which the sample was drawn.
- The T-test can be used to test hypotheses, compare the effectiveness of different treatments, or examine the relationship between two variables.
Origin of T-test
A T-test was conducted for the first time by William Sealy Gosset, an English statistician, chemist and brewer. While working for a brewing company called Guinness, he applied the t-test to observe the consistent character of the stout.
Eventually, this test was upgraded with its current connotation, referring to any hypothesis test whose data variables follow a t-distribution (a bell-shaped curve with weighty tails) if the null hypothesis proves accurate.
When can a T-test be conducted?
A T-test has to adhere to the following conditions for a standard interpretation and validation.
- The sets of observed data should not be more than two.
- The data should be sampled randomly.
- The sample size must not be more than 30.
- The data variables must be independent.
- The data variables must reflect an approximately normal distribution.
- The variance needs to be unknown and homogenous.
- The outcome of the scale of measurement applied to the collected data must follow a continuous line.
Which kind of T-test is most suitable?
The choice of a type of T-test will primarily depend on two things:
- Whether the collected data sets belong to the same or two different populations.
- The test conductor intends to examine the difference in a particular direction.
Based on the nature of the sample population, a T-test may be classified into three types.
- One Sample T-test: It entails comparing the mean of a single data set with a known mean or standard value.
- Paired Sample T-test: It involves comparing the mean of a single set of observed data at different intervals before and after an experiment.
- Independent Samples T-test: Also known as Two-Samples T-test, it entails comparing two different sets of observed data and their averages.
Based on the test conductor’s intention to examine the difference in a particular direction, a T-test may be classified into the following two types.
- One-tailed T-test determines whether a population average is less or greater than the other population mean.
- Two-tailed T-test: It is used to determine whether there is a difference between two data sets.
How to conduct a T-test?
A T-test measures the real difference between the means of two sample groups by employing the ratio of the difference in sample group means over the pooled standard error of both sample groups.
The following formula can be used to run a two-sample or student’s t-test:
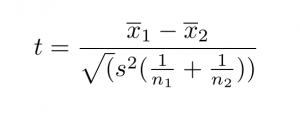
Here,
- t = value of the T-test
- x1 and x2 = Means of the two sample groups
- s2 = Pooled Standard Error of the two sample groups
- n1 and n2 = Number of Observations in each sample group
To determine if the computed t-value is more than the t-value expected by chance, one has to employ a critical value chart and compare the calculated t-value with the critical t-value.
If the computed t-value is indeed higher, it implies that the null hypothesis is rejected. Accordingly, one can conclude that the sample groups are indeed different.
What is t-score?
A t-score or t-value is a number that represents the extent of difference between the averages of two sets of observed data.
A higher t-score implies that the sample groups are different. In contrast, a smaller t-score means similarities between the sample groups.
Advantages of T-test
The following are some notable advantages of the T-test:
- It is one of the most straightforward and versatile tools for comparing two data sets.
- The output of the independent variables is easy to interpret.
- It requires a small sample size. Consequently, data collection is relatively more comfortable under a t-test.
- It is used to determine whether two sets of sample data belong to the same population. Consequently, it helps in obtaining the source of data.
Disadvantages of T-test
As a tool for hypothesis testing, T-test is quite conservative. The following are some significant limitations of the T-test.
- Only two sets of sample data can be compared using a T-test.
- The assumption of the sample data being random is not always right.
- Even though a T-test can help determine the source of a given data set, environmental factors can significantly affect its outcomes and make the results unreliable.
- https://www.ncbi.nlm.nih.gov/pmc/articles/pmc4667138/
- https://scholarworks.umass.edu/cgi/viewcontent.cgi?article=1307&context=pare
- https://onlinelibrary.wiley.com/doi/abs/10.1002/bimj.4710280202
Last Updated : 11 June, 2023


Emma Smith holds an MA degree in English from Irvine Valley College. She has been a Journalist since 2002, writing articles on the English language, Sports, and Law. Read more about me on her bio page.


It provides a deep understanding of the T-test.
Agreed, it’s a very comprehensive explanation.
This explanation is too detailed and can be overwhelming for someone new to the subject.
I agree, it might be too much for beginners.
The level of detail is great for those already familiar with statistics.
The writing is rich with detailed content, not leaving anything out.
A bit too detailed, might benefit from some simplification.
Precise and rich in detail, I agree.
This article is too long and technical. It could use some simplification.
I understand, but it’s great for those interested in an in-depth understanding.
An extensive amount of detail, a must-read for those interested in the topic.
Absolutely, a valuable and comprehensive resource.
It is very thorough, providing all the necessary details about the T-test.
The level of detail makes it an exceptional resource.
Maybe a bit too much information for some readers.
A solid and detailed overview of the T-test.
Indeed, well articulated and comprehensive.
However, it might be too complex for those not well-versed in statistics.
The author did a fantastic job of explaining every aspect of the T-test.
Yes, it’s an in-depth analysis of the topic.
The T-test explained thoroughly, with no detail missing. Very informative.
Absolutely, excellent analysis of the topic.
I would say it is an excellent breakdown of the T-test concept. Thank you!
The article is indeed comprehensive and well explained.