A t-test is used to compare sample means when the population standard deviation is unknown or when dealing with small sample sizes, while a z-test is appropriate when the population standard deviation is known and sample sizes are sufficiently large.
Key Takeaways
- T-tests are used to compare the means of two groups when the population standard deviation is unknown, while Z-tests are used when the population standard deviation is known, and the sample size is large.
- T-tests rely on the t-distribution, which is used for smaller sample sizes and unknown population standard deviations, whereas Z-tests use the standard normal distribution.
- In practice, t-tests are more common due to the rarity of known population standard deviations. At the same time, Z-tests are reserved for situations with large sample sizes and known population parameters.
T-test vs Z-test
The Z-test is used when the population mean and the standard deviation is known, it assumes that the population is normally distributed. The t-test is used when the population standard deviation is unknown and must be estimated from the sample data. The t-test assumes that the sample is normally distributed.

A T-test is best for problems with limited sample sizes, whereas a Z-test works best for problems with large sample sizes.
Comparison Table
| Aspect | T-Test | Z-Test |
|---|---|---|
| Use case | Used when the sample size is small (<30) or the population standard deviation is unknown. | Used when the sample size is large (>30) and the population standard deviation is known. |
| Sample size | Suitable for small sample sizes. | Suitable for large sample sizes. |
| Formula | t = (x̄ – μ) / (s / √n) | z = (x̄ – μ) / (σ / √n) |
| Population parameters | Typically used when population parameters (mean and standard deviation) are unknown. | Typically used when population parameters (mean and standard deviation) are known or estimated. |
| Degrees of freedom | Uses n-1 degrees of freedom (where n is the sample size) for a two-sample t-test. | Uses n degrees of freedom for a one-sample z-test. |
| Assumption of variance | Assumes that the sample variance is an unbiased estimator of the population variance. | Assumes that the population variance is known or can be reasonably estimated from the sample. |
| Distribution | Follows a t-distribution, which has heavier tails compared to the standard normal (z) distribution. | Follows a standard normal (z) distribution. |
| Example | Testing whether the mean test scores of two different groups are significantly different when the sample sizes are small and the population standard deviations are unknown. | Testing whether the mean height of a population is significantly different from a known value when the sample size is large and the population standard deviation is known. |
| Statistical software | Commonly performed using software like R, Python, or statistical calculators. | Commonly performed using software like R, Python, or statistical calculators. |
What is T-Test?
A t-test is a statistical method used to compare the means of two groups and determine if there is a significant difference between them. It is commonly employed in hypothesis testing when the data follows a normal distribution.
Types of T-Tests
- Independent Samples T-Test:
- Used when comparing the means of two independent groups.
- Assumption: Data in each group is normally distributed, and variances are approximately equal.
- Paired Samples T-Test:
- Applied when comparing the means of two related groups, such as before and after measurements.
- Assumption: The differences between paired observations are normally distributed.
Hypotheses in T-Test
In a T-Test, hypotheses are formulated as follows:
- Null Hypothesis (H₀): Assumes no significant difference between the group means.
- Alternative Hypothesis (H₁): Suggests a significant difference between the group means.
Interpretation
- If the p-value is below the significance level (commonly set at 0.05), the null hypothesis is rejected, indicating a significant difference.
- Conversely, a p-value above the significance level fails to reject the null hypothesis.
What is Z-Test?
A Z-test is a statistical method used to determine if there is a significant difference between sample and population means, or between the means of two independent samples. It is particularly useful when dealing with large sample sizes and when the population standard deviation is known.
Types of Z-Tests
- One-Sample Z-Test:
- Objective: To assess if the mean of a single sample is significantly different from a known population mean.
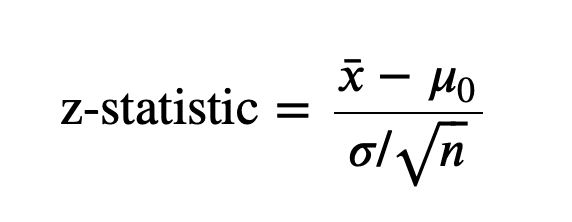
- Formula: Z = (X̄ – μ) / (σ / √n), where X̄ is the sample mean, μ is the population mean, σ is the population standard deviation, and n is the sample size.
- Two-Sample Z-Test:
- Objective: To compare the means of two independent samples and determine if there is a significant difference between them.
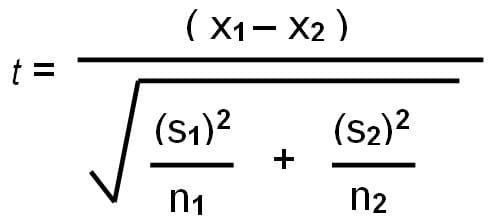
- Formula: Z = (X̄₁ – X̄₂) / √(σ₁²/n₁ + σ₂²/n₂), where X̄₁ and X̄₂ are the sample means, σ₁ and σ₂ are the standard deviations, and n₁ and n₂ are the sample sizes.
- Z-Test for Proportions:
- Objective: To examine if the proportion of a categorical variable in a sample is significantly different from a known population proportion.
- Formula: Z = (p̂ – p₀) / √(p₀(1 – p₀)/n), where p̂ is the sample proportion, p₀ is the population proportion, and n is the sample size.
Hypothesis Testing with Z-Test
Hypothesis testing involves setting up a null hypothesis (H₀) and an alternative hypothesis (H₁ or Ha):
- Null Hypothesis (H₀): Assumes no significant difference or effect.
- Alternative Hypothesis (H₁ or Ha): Claims a significant difference or effect.
The decision to reject the null hypothesis is based on the calculated Z statistic and a chosen significance level (α). If the calculated p-value is less than α, the null hypothesis is rejected, indicating statistical significance.
Main Differences Between T-Test and Z-Test
- Sample Size:
- T-Test: Typically used when the sample size is small (<30) or when the population standard deviation is unknown.
- Z-Test: Typically used when the sample size is large (>30) and when the population standard deviation is known or can be accurately estimated.
- Population Standard Deviation:
- T-Test: Does not require knowledge of the population standard deviation; it can estimate it from the sample.
- Z-Test: Requires knowledge of the population standard deviation or a sufficiently large sample size to estimate it from the sample.
- Formula:
- T-Test: The formula for the T-test involves the sample mean, sample standard deviation, sample size, and, optionally, the population mean.
- Z-Test: The formula for the Z-test involves the sample mean, population mean, population standard deviation, and sample size.
- Degrees of Freedom:
- T-Test: Uses (n – 1) degrees of freedom for a two-sample T-test and (n – 1) degrees of freedom for a one-sample T-test (where n is the sample size).
- Z-Test: Uses n degrees of freedom for a one-sample Z-test.
- Distribution:
- T-Test: Follows a t-distribution with heavier tails compared to the standard normal (z) distribution.
- Z-Test: Follows a standard normal (z) distribution.
- Assumption of Variance:
- T-Test: Assumes that the sample variance is an unbiased estimator of the population variance.
- Z-Test: Assumes that the population variance is known or can be reasonably estimated from the sample.
- Use Cases:
- T-Test: Commonly used when the sample size is small, the population standard deviation is unknown, or when comparing means of two groups with small sample sizes.
- Z-Test: Commonly used when the sample size is large, the population standard deviation is known, or when comparing means of two groups with large sample sizes.
- Statistical Software:
- T-Test: Commonly performed using statistical software like R, Python, or statistical calculators.
- Z-Test: Also commonly performed using statistical software like R, Python, or statistical calculators.
Last Updated : 25 February, 2024

Piyush Yadav has spent the past 25 years working as a physicist in the local community. He is a physicist passionate about making science more accessible to our readers. He holds a BSc in Natural Sciences and Post Graduate Diploma in Environmental Science. You can read more about him on his bio page.


The post presents an insightful comparison between t-test and z-test, although it might have benefited from discussing the assumptions and limitations of each.
Quite an engaging read! Kudos to the author for breaking down complex statistical concepts in such a comprehensive manner.
Indeed, it’s a testament to their expertise in the field.
Definitely, Alexa. The author has done a remarkable job of simplifying the concepts.
Can’t deny the usefulness of t-tests and z-tests, but a discussion on the assumptions underlying these tests would have been beneficial.
Valid point, Helena. Understanding the assumptions is equally important.
I found the segment on ‘What is T-Test?’ and ‘What is Z-Test?’ particularly enlightening. This will undoubtedly aid my statistical analysis work.
Agreed, it’s great to see practical applications of these tests being discussed.
The post is quite informative and provides a clear distinction between t-test and z-test, very useful for those dealing with statistical analysis.
I appreciate the comprehensive comparison and the practical examples provided.
The discussion on the t-distribution and the standard normal distribution is particularly valuable. Good to see a focus on the underlying distributions.
Absolutely, Isabel. Understanding the distributions is crucial for anyone using these tests.
The distinction between t and z-tests is crystal clear. I appreciate the detailed explanation with examples provided.
I second that, Amorris. The clarity of the explanations is impressive.
Indeed, the examples really help solidify the understanding.
I’m not entirely convinced that t-tests are more common in practice. It depends on the field and the nature of the data being analyzed.
I see your point, Leanne. The prevalence of t-tests might vary across disciplines.
I found the comparison table particularly helpful. It makes it easier to understand the different use cases and parameters for both tests.
An excellent comparison between t-test and z-test, it really helps clarify the situations in which one is more appropriate than the other.
Absolutely agree, this has been very informative.