Mac OS X Task Manager
What is the Task Manager?
The Task Manager in Mac OS X is an essential tool called Activity Monitor that helps you manage and monitor the performance of your Mac. It provides detailed information on the processes and applications currently running on your system. This powerful utility helps you identify resource-hungry apps, optimize your system performance, and troubleshoot any issues that may arise.

Why Use the Task Manager?
Using the Task Manager on your Mac is crucial for several reasons:
- Monitor system performance: The Task Manager helps you track CPU, memory, energy, disk, and network usage in real time, enabling you to spot potential bottlenecks and take timely action.
- Identify resource-consuming apps: The Task Manager lists all the running apps and processes, sorting them by resource consumption, which allows you to pinpoint the culprits and decide whether to quit or terminate them.
- Manage your applications: The Task Manager lets you quickly quit, force quit, or even relaunch unresponsive apps without restarting your entire system.
- Troubleshoot problems: The Task Manager is an invaluable tool for identifying and resolving performance-related issues by providing in-depth information about running processes and system utilization.
Accessing the Task Manager
There are several ways to access the Task Manager (Activity Monitor) on your Mac:
- Finder: Open the Finder and navigate to Applications > Utilities. Double-click on the Activity Monitor icon.
- Spotlight: Press
Command + Spaceto open Spotlight Search, type “Activity Monitor,” and hitReturn. Click the “Activity Monitor.app” icon in the Spotlight results. - Dock: If you frequently use the Task Manager, consider adding it to your Dock for quick access. To do this, open Activity Monitor through the Finder or Spotlight and drag its icon from the app window to the Dock.
- Keyboard shortcut: Press
Command + Alt + Escto access a simplified Task Manager version showing a list of currently opened programs and applications.
By familiarizing yourself with the Mac OS X Task Manager, you can proactively monitor and manage your system, ensuring optimal performance and smoother operation.
Breaking Down the Interface
This section will review the different tabs available in the Mac OS X Task Manager, also known as the Activity Monitor. This will help you navigate the utility more effectively.
CPU Tab
The CPU Tab displays information about the processor usage by each running application and process on your Mac. You’ll see a list of processes and the percentage of CPU they use. Additionally, you can view the total percentage of CPU being utilized at the bottom of the window. Keep an eye on any process with high CPU usage, as it could slow down your Mac’s performance.
Memory Tab
The Memory Tab shows you how your Mac’s memory resources are used. You will find a list of running processes and their memory consumption in this tab. At the bottom of the window, there’s an overview of the physical memory usage, including how much memory is used and what portion is compressed, cached, etc. Monitoring memory usage can help you identify memory-hungry applications that might impact your Mac’s performance.
Energy Tab
The Energy Tab provides insights into the energy consumption of each running application or process. This tab is especially useful for those using portable Macs, as keeping an eye on energy usage can help improve battery life. The Energy Impact column shows a relative measure of the energy consumption of each process. Lower values are better, as they indicate lower energy usage.
Disk Tab
In the Disk Tab, you can monitor the read and write activities of your Mac’s hard drive. This tab displays disk usage by each application and process, including how much data is being read or written and the number of read/write operations. Regularly monitoring disk activities can help you identify applications with excessive disk usage, which could affect your Mac’s responsiveness.
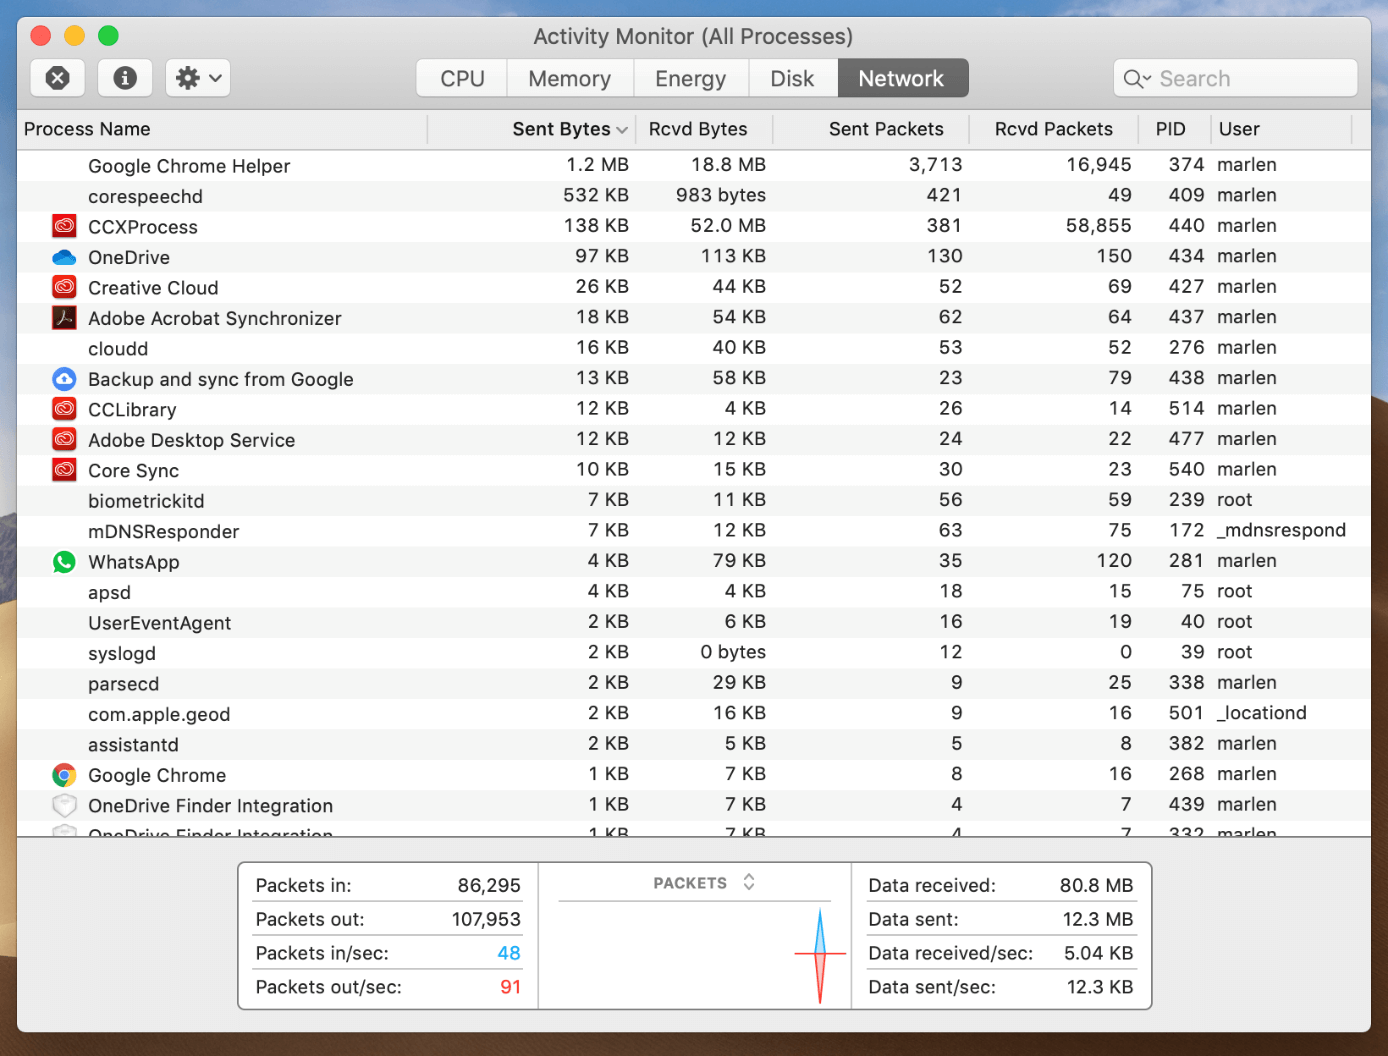
Network Tab
Lastly, the Network Tab overviews your Mac’s network activity. You can view information about data sent and received by each application or process. This can be beneficial in identifying software causing unnecessary network usage, which might result in slower Internet speeds or higher data consumption.
Managing Processes
Terminating Processes
To terminate a process on your Mac, follow these steps:
- Open the Activity Monitor by pressing
CMD+Spacebarand Search for “Activity Monitor” in Spotlight, or navigate to Applications > Utilities > Activity Monitor. - You’ll see a list of currently running processes in the Activity Monitor window.
- Find the process you want to terminate and select it.
- Click the “X” button in the upper-left corner of the window.
- You’ll be prompted to confirm if you want to quit or force quit the process. Select the appropriate option.
Be cautious when terminating processes, as doing so may cause data loss or system instability.
Renaming Processes
Unfortunately, you cannot directly rename processes on a Mac through the Activity Monitor. Process names are determined by the application or service that is running the process. If you need to change the name displayed in the Activity Monitor, you must modify the underlying application or service.
Viewing Process Information
To view more information about a specific process, follow these steps:
- Open the Activity Monitor as described earlier.
- Select the process you’re interested in.
- Click the “i” button in the window’s upper-left corner, or double-click the process in the list.
This will open a new Process Information window, which includes detailed information such as:
- Process Name: The name of the process.
- User: The user account running the process.
- % CPU: The percentage of CPU usage by the process.
- Memory: The amount of memory being used by the process.
- Energy: The energy impact of the process on battery life.
- Disk: The disk space used by the process.
- Network: The network usage of the process.
You can also view information in different tabs like “Open Files and Ports,” “Memory,” and “Statistics.” These tabs provide more granular data about the selected process, helping you better understand its behavior and resource usage.
How to Spot Resource-Hungry Applications
As a Mac user, monitoring and managing your system’s resources is essential. Sometimes, applications can consume more resources than they should, causing your computer to slow down or become unresponsive. In this section, you’ll learn how to spot resource-hungry applications using the Mac OS X Task Manager.
To start, open Activity Monitor on your Mac, the OS X Task Manager. You can access Activity Monitor by clicking the ‘magnifying glass’ icon in your menu bar or by pressing Command+Space. Type “activity monitor” in the Spotlight Search bar, and press ‘Return’ or click on the ‘Activity Monitor.app’ icon in the Spotlight results.
Once inside Activity Monitor, you’ll see several tabs at the top of the window. These tabs give you a comprehensive overview of your system’s usage, including CPU, Memory, Energy, Disk, and Network usage.
To spot resource-hungry applications, first, check the CPU tab. Here, you’ll find a list of processes running on your Mac, sorted by the percentage of CPU utilization. Monitor processes consistently showing high CPU usage, which can slow down your computer.
Next, switch to the Memory tab. Memory usage is an essential factor as it affects the overall performance of your system. The Memory tab shows each application’s RAM usage. A high memory consumption by a specific process can lead to sluggish performance or system crashes. Look for processes that consume significant memory, especially when your system feels slow.
Remember that some applications may require more resources during certain tasks or periods when analyzing resource usage. For example, photo or video editing software may consume more CPU and memory while processing large files. However, if you find an application consistently consuming excessive resources, it could indicate a problem with that application.
In conclusion, monitoring your Mac’s resource usage with Activity Monitor can help you efficiently spot and manage resource-hungry applications. By keeping track of your system’s resource consumption, you can ensure optimal performance and troubleshoot potential issues before they create more significant problems.
Using the Task Manager to Close Applications
To manage applications on your Mac efficiently, it is essential to learn how to use the Task Manager, known as Activity Monitor on Mac OS X. This tool allows you to view and close unresponsive or unnecessary applications that may be consuming resources on your computer.
To open the Activity Monitor, follow these steps:
- Open Finder.
- Go to Applications.
- Scroll down to Utilities and open it.
- Click on the Activity Monitor icon.
Alternatively, you can press Command + Spacebar, search for “Activity Monitor” in Spotlight, and open it from there.
Once you open the Activity Monitor, you will see detailed information about all the processes and applications currently running on your Mac. The window is divided into several tabs: CPU, Memory, Energy, Disk, and Network. Each tab provides insights into different aspects of your computer’s performance.
To close an application using the Activity Monitor, follow these steps:
- Select the process or application that you wish to close from the list.
- Click the “X” button in the upper left corner of the Activity Monitor window.
- A confirmation dialog will appear. Click the “Quit” or “Force Quit” button, depending on whether the application is responsive.
The “Force Quit” option is recommended if an application is unresponsive. However, be cautious when using this option, as forcing an application to quit may result in the loss of unsaved data or even cause system instability in some cases.
Additionally, if you ever need to quickly close a stuck or unresponsive application without opening the Activity Monitor, you can press Command + Option + Esc to open the “Force Quit Applications” dialog. Select the application you want to close and click the “Force Quit” button.
Using the Task Manager (Activity Monitor) on your Mac allows you to manage applications and optimize your computer’s performance efficiently.
Utilizing the Search Function
Before diving into the search function within the Mac OS X Task Manager, let’s briefly discuss the tool. The Task Manager on a Mac is called the Activity Monitor, and it displays detailed information about various processes and applications running on your system.
To open the Activity Monitor, press Command + Spacebar and search for “Activity Monitor” in Spotlight. Alternatively, you can navigate to the Utilities folder within the Applications folder via Finder and click the Activity Monitor icon.
Now, let’s focus on utilizing the search function within the Activity Monitor. You will find a search bar in the top-right corner of the Activity Monitor window. This allows you to quickly and efficiently filter the list of processes displayed.
Using search keywords: You can search using the names of applications or specific process names. As you type in your keywords, the Activity Monitor will automatically filter the process list, showing only matching results. This is helpful when locating a specific process or investigating an application that may cause performance issues.
Narrowing down results: You may encounter multiple results when searching for processes. To narrow your search, add more precise keywords or use additional search terms. For example, if you are looking for a specific Chrome tab, use the full title of that web page as your search term.
In conclusion, the search function in the Mac OS X Task Manager, or Activity Monitor, is a powerful tool that can help you quickly locate and manage specific processes. Utilizing this feature effectively will enable you to monitor and optimize your system’s performance.
Understanding System Statistics
To effectively use the Mac OS X Task Manager, it’s important to understand the system statistics it displays. The Task Manager on a Mac is called Activity Monitor, which provides vital information about your Mac’s processor, disks, memory, network, and more.
To open the Activity Monitor, go to Finder > Applications > Utilities > Activity Monitor or use the Spotlight Search by pressing Command+Space, typing “activity monitor,” and hitting “Return.”
Once the Activity Monitor is open, several tabs are available at the top, including “CPU,” “Memory,” “Energy,” “Disk,” and “Network.” Each of these tabs displays relevant statistics and information related to that particular system resource.
- CPU: This tab shows details about your processor usage, including the percentage of CPU used by each process, the time each process has spent using the CPU, and a real-time graph displaying overall system CPU usage.
- Memory: In this tab, you will find information about your Mac’s RAM usage. A graphical breakdown at the bottom of the window displays the relationship between Physical Memory and Memory Used. You can also identify memory-hungry programs and applications in the list and press the X button to quit them if needed.
- Energy: This tab is vital for Mac laptop users, providing insights into how each running application or process consumes battery power. It can help you determine which apps or processes to close to prolong battery life.
- Disk: The Disk tab displays how much data is being read and written to your Mac’s storage drives. This can help you identify processes causing excessive disk usage, which may slow down your system.
- Network: In the Network tab, you can see how much data your Mac sends and receives over your network connections. This is useful for monitoring network activity, identifying which processes use the most bandwidth, and troubleshooting connectivity issues.
By familiarizing yourself with these system statistics, you’ll be better equipped to manage your Mac’s resources effectively and ensure optimal performance. Remember to keep an eye on the most relevant statistics to your needs, and use the information provided by the Activity Monitor to make informed decisions about managing your Mac’s processes and resource usage.
Recognizing and Responding to System Issues
As a Mac user, you may encounter situations where your system seems to slow down or experience unresponsive applications. Detecting and addressing these issues is crucial to maintain optimal performance. The Activity Monitor is the macOS equivalent of Task Manager, providing valuable insights into your system’s processes and resource usage.
First, let’s learn how to open the Activity Monitor. You can access it by pressing CMD + Spacebar to open Spotlight Search, typing “activity monitor,” and hitting the Return key. Alternatively, you can find it in the Utilities folder within the Applications directory.
Upon launching the Activity Monitor, you will see several tabs: CPU, Memory, Energy, Disk, and Network. By default, the CPU tab will be open, showing a list of all running processes on your Mac and their respective CPU usage. This information helps you identify processes consuming significant resources, potentially causing a slowdown or freezing.
It might be time to take action if you notice an unresponsive application or process. The Activity Monitor enables you to Force Quit troublesome processes in simple steps. First, select the process causing issues by clicking on its name in the list. Then, click the X button located in the top-left corner of the Activity Monitor window to force-quit the process. This action will terminate the problematic process, allowing your system to run smoothly.
Additionally, monitor your Mac’s memory usage by checking the Memory tab in the Activity Monitor. This tab displays information on how your system’s RAM resources are utilized. High memory usage can lead to overall system slowdowns. Identifying memory-hogging applications and force-quitting them might enhance your Mac’s performance.
Lastly, use the Energy, Disk, and Network tabs for further insights into your system’s resource usage. Monitoring these metrics can help you become more aware of your Mac’s background activities and make informed decisions about resource allocation.
Using the Activity Monitor effectively, you can quickly identify and mitigate system issues, ensuring your Mac runs at peak performance.
Advanced Task Manager Techniques
In this section, we will explore some advanced techniques for using the Mac OS X Task Manager, also known as Activity Monitor. These techniques will help you customize the Activity Monitor, track energy usage, monitor network activity, and use terminal commands for task management.
Customizing the Activity Monitor
If you would like to customize the view of your Activity Monitor, you can do this by:
- Open Activity Monitor (Finder > Applications > Utilities > Activity Monitor).
- In the toolbar at the top of the Activity Monitor window, you can select tabs like CPU, Memory, Energy, Disk, and Network to view different categories.
- Click on the “View” menu and select “Columns” to choose which data columns you want to display or hide.
Energy Usage
Monitoring your Mac’s energy usage is essential for maintaining battery life. You can observe this in the Activity Monitor:
- Open the Activity Monitor and click on the “Energy” tab.
- Observe the energy impact of each running application displayed in the list.
- Take note of programs with high energy usage, as this can reduce battery life.
Network Activity
Staying informed about your Mac’s network activity can help diagnose network issues and reduce data usage. The Activity Monitor provides a way to view your network activity:
- Open Activity Monitor and click on the “Network” tab.
- You can view the data sent and received through the Mac’s network connections.
- Keep an eye on applications that use excessive data, which may cause slow connection speeds or consume your data allowance.
Terminal Commands for Task Management
In addition to using Activity Monitor, you can manage tasks using Terminal commands. Here are a few commands to help with task management:
top: This command provides an overview of the running processes, similar to Activity Monitor. Typetopin Terminal and press Enter.ps: To list running processes, typeps -axin Terminal and press Enter.killYou need its PID (Process ID) to terminate a process. Typekill [PID]in Terminal, press Enter (replace [PID] with the actual process ID).niceandrenice: These commands help you set priorities for running processes. Lower-priority tasks are less likely to cause performance issues. Typenice -n [priority] [command]to set priority when starting a new process orrenice [priority] -p [PID]to change the priority of a running process (replace [priority] with a value between -20 and 19 and [PID] with the actual process ID).
Using these advanced techniques will allow you to make the most of your Mac’s task management capabilities, which can improve system performance and efficiency.
Tips and Tricks for Effective Usage
Keyboard Shortcuts
Utilizing keyboard shortcuts can streamline your usage of the Mac OS X Task Manager, also known as Activity Monitor. By pressing Command + Option + Esc keys together, you can instantly bring up the list of applications currently running on your Mac. This shortcut serves as the Mac equivalent of Ctrl-Alt-Delete in Windows.
Setting Up Alarms and Notifications
Keep track of your Mac system’s performance by setting alarms and notifications for specific events. This can be particularly helpful if you’re concerned about memory usage, CPU load, or other performance indicators. You can use the Activity Monitor tool and create custom notifications for the most important indicators. With the right configuration, you can receive instantaneous alerts as resources begin to approach capacity or other crucial thresholds.
Automating Task Management
Automation can save time and reduce the likelihood of manual errors in task management. In MacOS, you can use built-in tools, including Automator and AppleScript, to create custom scripts for routine tasks. These scripts could be anything from launching applications to managing file folders or optimizing your Mac’s performance. By automating these processes, you can ensure efficient management of your system resources and maintain a better overall user experience.
