Data analytics is a trending and developing technology. Microsoft Power BI and Tableau are two different platforms that help you create dashboards and work with a large data set.
These dashboards are favoured for their effective working and data analytics evolves a profession.
Key Takeaways
- Power BI offers a comprehensive suite of data visualization tools at a lower cost, while Tableau focuses on advanced, customizable data visualizations.
- Power BI has native integration with other Microsoft products, while Tableau provides more extensive data source compatibility.
- Power BI suits small to medium-sized businesses, whereas Tableau caters to larger organizations with more complex data visualization needs.
Microsoft Power BI vs Tableau
Microsoft Power BI is a business analytics tool from Microsoft that offers interactive visualizations, data integration, and simplified reporting, with seamless Excel integration. Tableau is a data visualization tool known for its drag-and-drop interface, used for understanding data and creating insightful reports.

Tableau is also a business intelligence used to analyze data and visual data to give meaningful information like Power BI—one of the most excellent performing ETL tools to transform data into chats.
To access data, we use SQL and other software to get information, but in the case of Tableau, we can directly fetch data from the warehouse.
Reportedly, Tableau uses Ram to two perform operations on data and dashboards, which brings usage to get more efficient speed to process their data.
Comparison Table
| Parameters of comparison | Microsoft Power BI | Tableau |
|---|---|---|
| User Interface | Microsoft Power BI has better UI | Tableau UI is complex |
| Features | Online analytical processing and reporting | Data blending and dashboard commenting |
| Data sources connection | Microsoft Power BI can connect to limited data sources | Tableau can connect to large data sources |
| Embedding report | Easy in Power BI | Difficult in Tableau |
| Products | Power BI has five different products | Tableau has seven different products |
What is Microsoft Power BI?
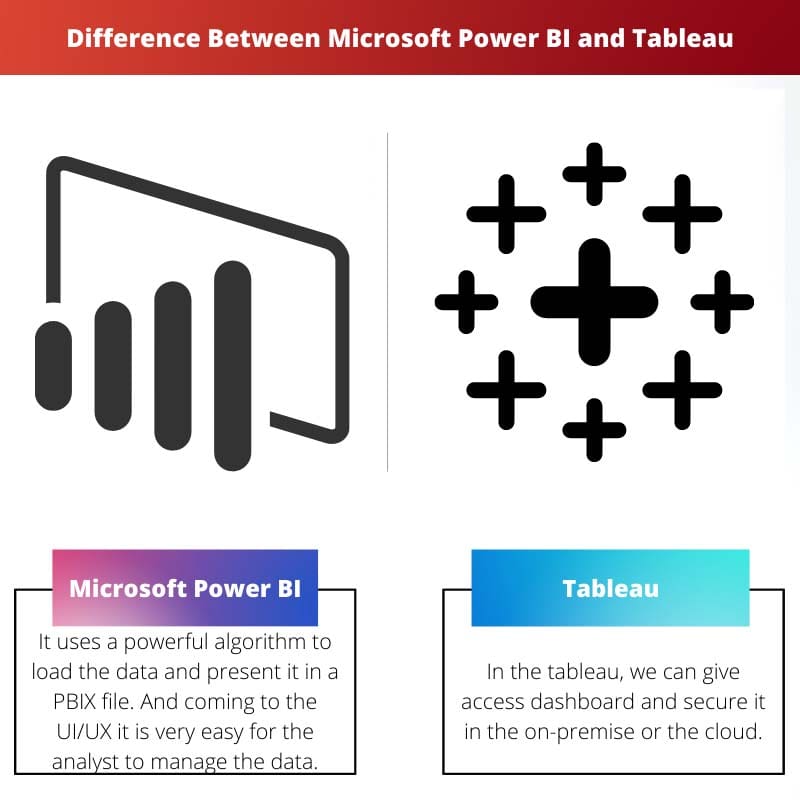
It uses a powerful algorithm to load the data and present it in a PBIX file. And coming to the UI/UX, it is very easy for the analyst to manage the data.
We have to get down functionality, and we can format the data within the shell. Since it uses artificial intelligence and machine learning it is backed up with automated dashboard creation for the given data set.
Since Azure is from Microsoft so they can manipulate data from the cloud and can manipulate data more efficiently. Which brings more advantages for Power BI.
For real-time analytics and dashboard, we can fetch details from any social media to get real-time analytics of a dashboard which makes business decisions more efficient.
The major disadvantage of power PI is it handles a Limited volume of data. That is it cannot accept files of more than 1 GP.
In Power Bi, we have online analytical processing (OLAT), which is helpful for their analyst to access the dashboard online.
It is also integrated with Python and R coding. We can use trend indicator, which helps analyze business and product Data analytics.
In Power BI, useless DAX for calculating and measuring the columns, which are helpful for small and medium types of organizations. It focuses more on reporting and modelling but not on storing the data.

What is Tableau?
In Tableau, we can give access dashboard and secure it in the on-premise or the cloud. The tablet uses MDX for measuring the dimensions and measures, which is very efficient for Ram conception.
In the real-time analysis, we can get data collaboration and notifications,, which is a significant advantage for Tableau.
It accesses a serious cloud platform and can handle a massive volume of data. The interface of a tableau is quite tricky compared to Power BI.
In Tableau, we can create no-code data queries and connect data using connectors. There is no need for any technical knowledge to use Tableau, but we have to understand some data analytics.
We have multiple products from Tableau, like the Tableau desktop, Tableau professional, Tableau personal, and Tableau public, which serve different variations based on service and distributed technologies for their organization.
Compared to power BI, it is pretty expensive for licensing costs. It is suitable for a large organization that can pay to license fees and manage other infrastructure. It does not offer artificial intelligence or machine learning for automated dashboard creation.
Main Differences Between Microsoft Power BI and Tableau
- Microsoft Power BI can not handle many datasets, whereas Tableau can handle many datasets.
- Compared to Tableau, Microsoft Power BI has limited customer services for its free version.
- Naive and experienced users can use Microsoft Power BI, but experienced users can use Tableau.
- On comparing Tableau, Microsoft Power BI is easy to learn and use.
- Microsoft Power BI is suitable for small and medium companies, whereas Tableau suits medium and large-sized companies.

- https://www.tandfonline.com/doi/full/10.1080/24751448.2018.1497381
- https://dspace.uii.ac.id/handle/123456789/15275

The insight provided about the user interface and features of both platforms was very insightful.
Yes, I particularly liked the comparison table. It neatly summarizes the differences.
The article could have been more engaging if it included case studies or practical examples of the implementation of both platforms.
Maybe the author wanted to keep it more theoretical and analytical. But I agree, case studies would have been beneficial.
Both platforms seem to have their own advantages and disadvantages. The comparison helped me understand the key differences.
I think the author could have included more visual aids to enhance the understanding of the differences.
The article provides a thorough and detailed comparison of Microsoft Power BI and Tableau
I agree, the article is very informative. Thanks!
This article is helpful for those who want to start a career in data analytics.